The Madison real estate market has changed from the fever pitch that characterized the months of March, April, May and June. The graph below shows how the market is changing. Each bar represents a snapshot of the single family home market taken mid-month. Each number reflects the percent of all Madison single family home listings that had an accepted offer at the time of the snapshot.
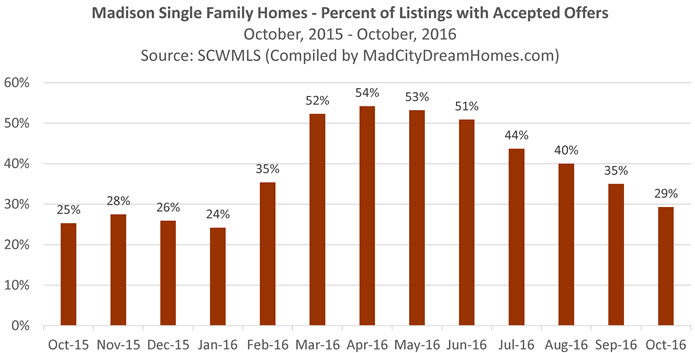
What Does the Data Say about the Spring Market?
If you were searching for a home in March, April, May or June, over 50% of the listings you viewed online were already under contract and scheduled for closing. These were wild and crazy times. Many new listings sold in a matter of days or even hours - after receiving multiple competing offers. Some buyers put their
…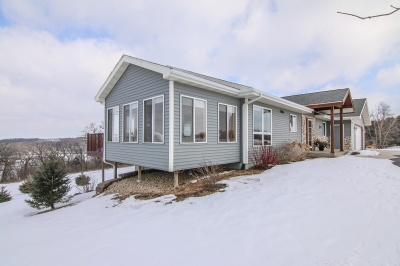 Let's face it. Winter in Wisconsin is long, cold, and, while often it is pretty, it's also messy. Trees are bare, landscaping is rarely visible, and your home can't have the same curb appeal that it has in warmer weather. Take this listing, for example. The home is in excellent condition and offers fabulous views. But the drab gray of winter keeps you from appreciating the rolling hills and beautiful views behind it.
 In true Wisconsin fashion, raising money for the Dane County Humane Society includes a beer at a local brewery. Bring your dog to Capital Brewery on Sunday afternoon. Dogtoberfest attracts about 500 guests and their four legged companions. Event organizers ask that animals be friendly and remain leashed throughout the event. Admission is a $10 donation at the door, and Capital Brewery's
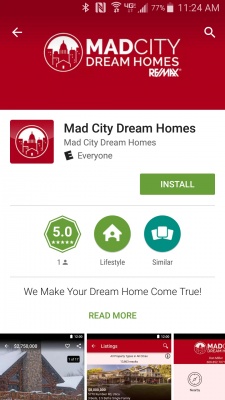
 At Mad City Dream Homes we offer several handy tools which help you focus your condominium search. We cover a few of our most popular condo search features below. Of course, you can contact us anytime and we'll do the searching for you. We're out pounding the pavement everyday in search of both listed and unlisted condominiums. Let us know what you're looking for, and we'll get to work for you. In the meantime, check out these features which are designed to make your search easier.