How to Use our Hyperlocal Market Data
Posted by Dan Miller, REALTOR on Thursday, November 5th, 2015 at 6:01am.
 We've added "hyperlocal" market data to our Mad City Dream Homes website which makes it easy to learn about the real estate market in your preferred neighborhood or condominium association. Our market data is sourced directly from our MLS data feed and updated every 15 minutes, so you can count on it for timely and accurate information. Below we offer 4 examples of how the data works and how you can use it to understand the nature of the market in your target destination.
Example 1: Neighborhood with a Hot Sellers' Market
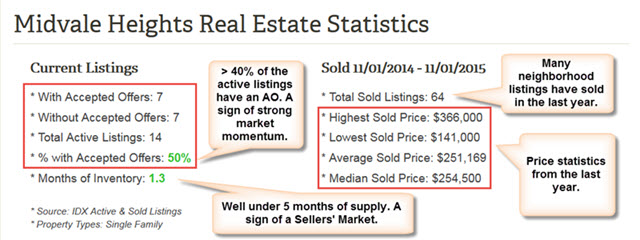
The screenshot below shows market data from the Midvale Heights neighborhood on the near west side of Madison. Scroll to the middle of our profile page and you'll find it. This data provides several clues which point to a very strong sellers' market in the neighborhood:
- Fifty percent of the listings in the neighborhood have an accepted offer, which is a tremendously high number for this time of year. In other words, if you're browsing the internet for a home in Midvale Heights, half of the listings you see are already under contract and scheduled to close soon. Hiring a skilled buyer agent is a must for anyone looking to buy a home in a hot market such as this one.
- Only 1.3 months of inventory are listed for sale. This is a very low number and another indication of a strong sellers' market.
- A total of 64 listings have sold in the last year. On average, more than 5 properties are selling each month. Properties are turning over at a rapid pace within the Midvale Heights neighborhood.
Example 2: Neighborhood with a Slower Market
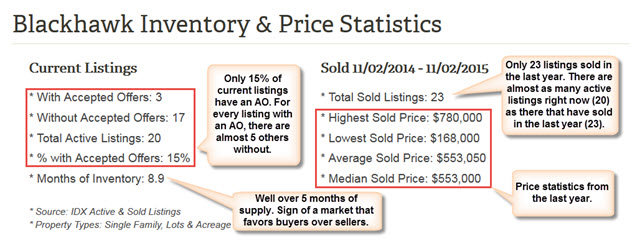
This second screenshot shows market data from the Blackhawk neighborhood on the far west side of the city. The data for this subdivision paints the picture of a slower market where the dynamics generally favor buyers over sellers (note, this is a common theme across many high-end neighborhoods).
- Only 15% of the listings in the subdivision have an accepted offer. For every listing that has an accepted offer, there are almost 5 others which do not. This is a sign of a market that favors buyers over sellers.
- Almost 9 months of inventory are currently listed for sale. This high number in another indicator of a buyers' market.
- Only 23 listings have sold in the last year. Right now there are almost as many active listings (20) as there are sales in the last 12 months (23). Yet another indication of a buyers' market.
Example 3: Condo Development with a Hot Sellers' Market
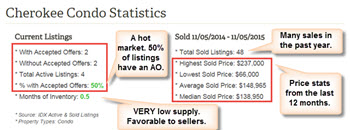
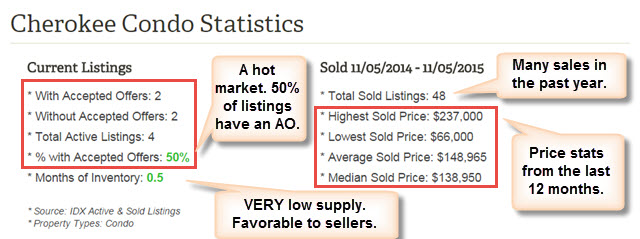
This third screen shot shows market statistics from the Cherokee Condominiums on the north side of Madison. This data offers a glimpse into a great sellers' market at Cherokee:
- Fifty percent of the listings in Cherokee have an accepted offer. This high percentages shows good momentum within the development.
- Only 0.5 months of supply are listed for sale. A very low number that points to a great sellers' market.
- A total of 48 Cherokee condo listings have sold in the last year. On average, 4 condos are selling each month. Properties are turning over quickly within the Cherokee development.
Example 4: Condo Development with a Slower Buyers' Market
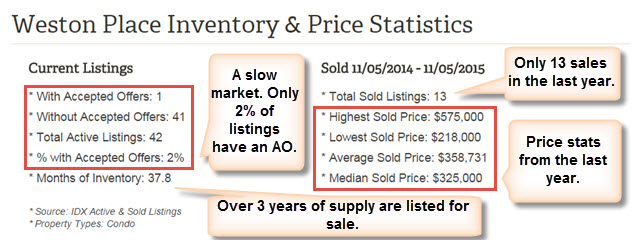
This last screenshot shows market data from the Weston Place Condominiums on the near west side of the city. The data for this development shows a market which favors buyers over sellers:
- Only 2% of the listings in the development have an accepted offer. Right now there is one listing with an accepted offer, and there are 41 listings without.
- Over 37 months of inventory are currently listed for sale. At the current sales rate it would take over 3 years to sell every condo that is currently listed on the MLS.
- Only 13 listings have sold in the last year. There are more than 3 times as many active listings (42) as there are sales in the last 12 months (13).
More Real Estate Market Information
Whether you plan to buy or sell, our statistics offer a helpful glimpse into the market at the hyperlocal level. For a more thorough review of your local market, we recommend a full-blown market analysis. Get in touch with us anytime you'd like to take a close look at the market in your neighborhood or condominium development. We can help you make sense of it.