
Middleton, WI Real Estate Trends:
June, 2018
The report below covers the latest price, sales, inventory, expired listing and days on market trends for single family homes in Middleton, Wisconsin. The report covers MLS location W04 (the city of Middleton) and MLS location D31 (the town of Middleton). All data comes from the South Central Wisconsin MLS database. Below is a snapshot from our June, 2018 report.
For our report on the Middleton condo market, click here.
Middleton Single Family Home Market Snapshot
- Middleton home sales through the month of June are down from last year due to lower levels of supply in the 2018 market.
- Accepted offers through July are lower, pointing to lower home sales totals in the months ahead.
- Expired listings are the lowest they have ever been during the first 6 months of the year.
- Similarly, the single family listing expiration rate is also the second lowest at 18% it has ever been on record in Middleton.
- New listings are down from last year, but they are still entering the market at a healthy rate. New construction is helping to maintain the supply of homes in Middleton. However, most of the inventory in Middleton is priced at $400,000 and above. Supply is very limited in the more affordable price ranges.
- As of 7/17/2018, there are 3.2 months of supply for Middleton single family homes. Inventory for homes priced between $150,000-$350,000 is extremely low. This segment of the market is very favorable to sellers. The market for homes priced at $350,000 and above is more favorable to buyers.
- Days on market are the lowest on record year to date - an indication of a seller's market.
- Middleton home prices continue to reflect a high demand/low inventory market. The price per square foot and average price through the month of June are trending near all-time highs.
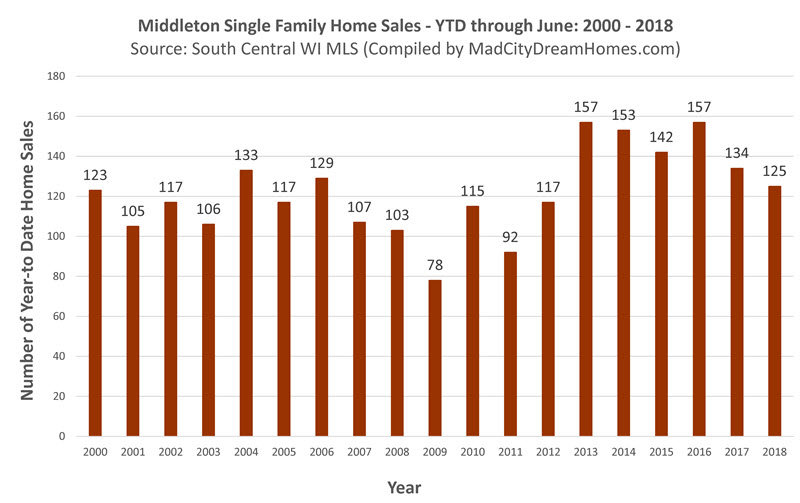
Middleton Single Family Home Sales - June, 2018
Middleton home sales are lower in 2018 due to lower supply. Year-to-date through June, a total of 125 Middleton single family home listings sold via the South Central Wisconsin MLS. Note, sales would be higher with more available inventory. We cover the latest inventory trends later in this report.
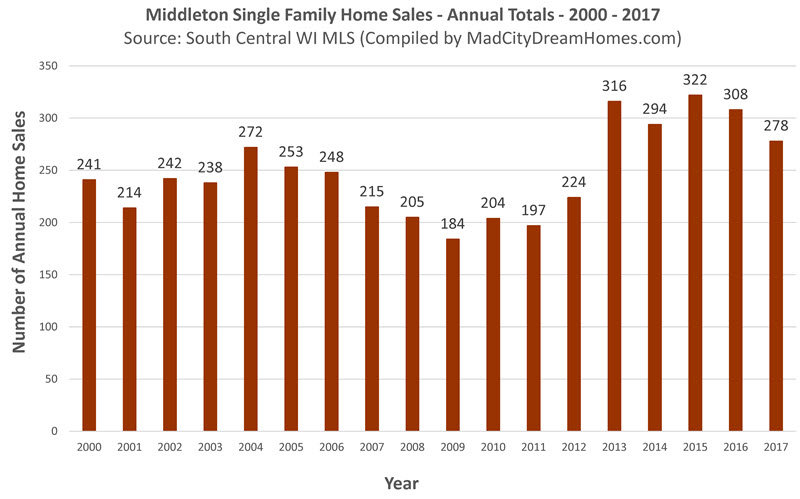
On an annual basis, a total of 278 Middleton single family listings sold in 2017, a significant decrease from the 308 listings sold in 2016. Middleton home sales have been trending along record high levels for the last 5 years.
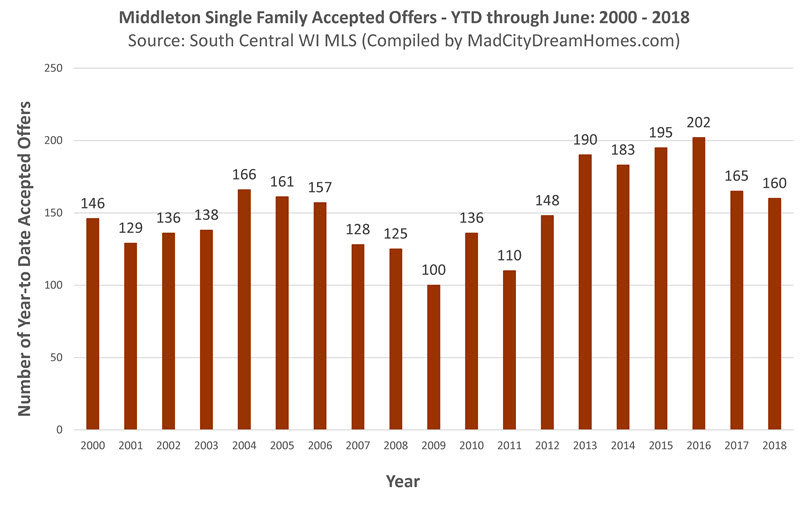
Middleton Single Family Accepted Offers - June, 2018
A total of 160 Middleton single family listings received accepted offers year-to-date through the month of June. This year's total through the month of June is markedly lower than last year - due to low levels of supply. These numbers foreshadow fewer closings in the months ahead.
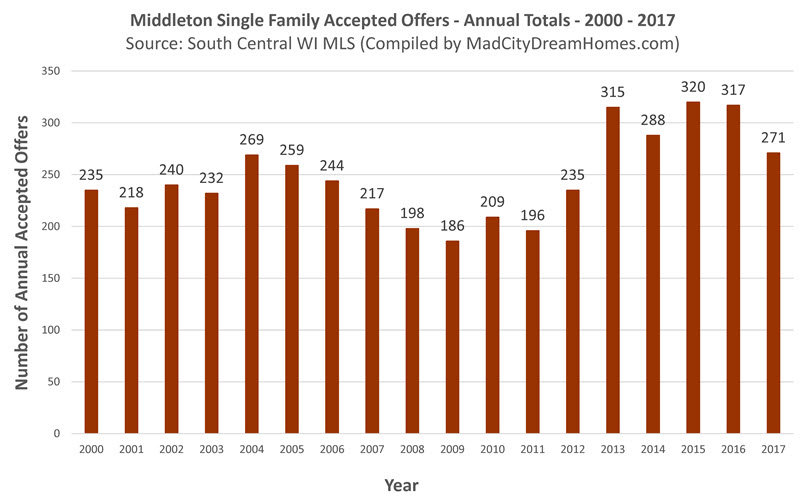
A total of 271 Middleton single family home listings received accepted offers in 2017. Although the total number of accepted offers from 2017 was less than the total from 2016, the 2017 total is still historically high.
Middleton Expired Single Family Listings - June, 2018
A total of 28 Middleton single family listings expired year-to-date through the month of June. This is the second lowest annual average number of days on market on record.
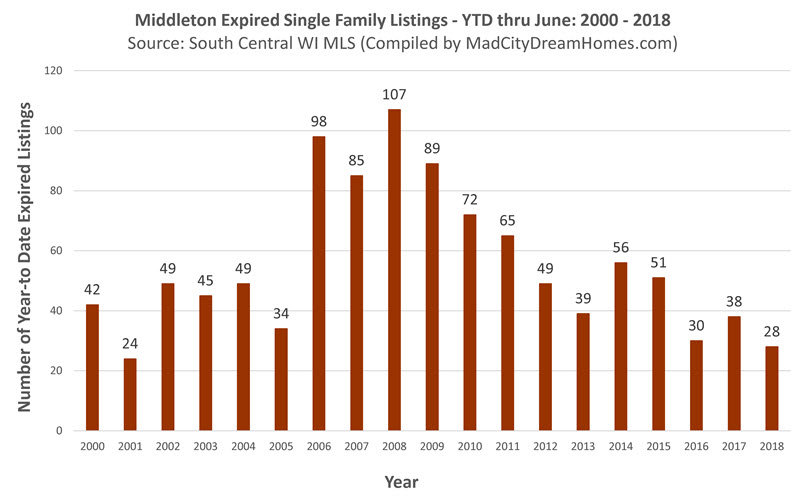
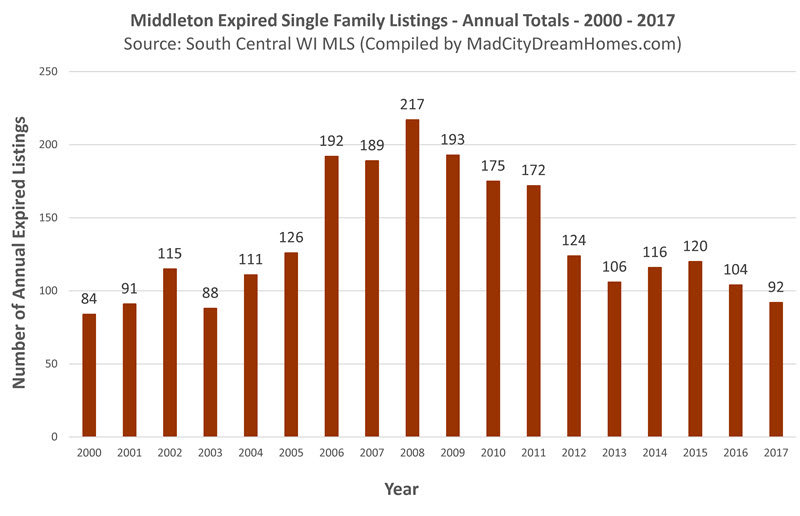
A total of 92 Middleton single family home listings expired in 2017. Expired listings have been running at low levels for the last 6 years.
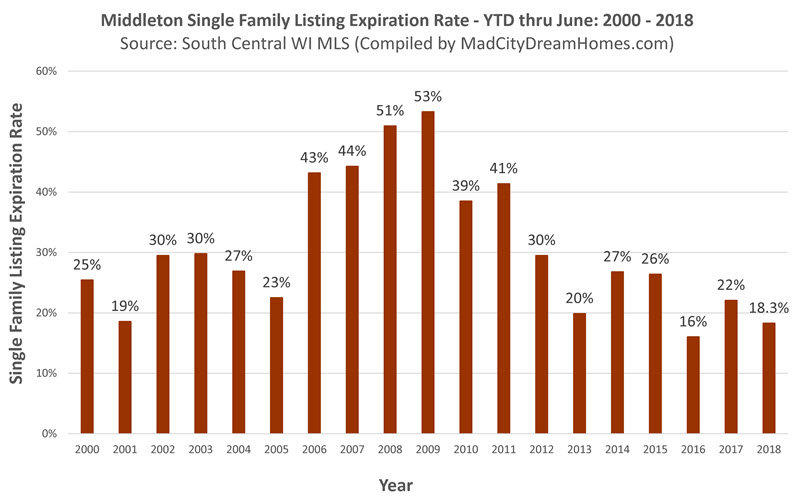
Middleton Single Family Expiration Rate - June, 2018
The year-to-date expiration rate for Middleton single family homes through the month of June is 18.3% . This is the second lowest rate on record.
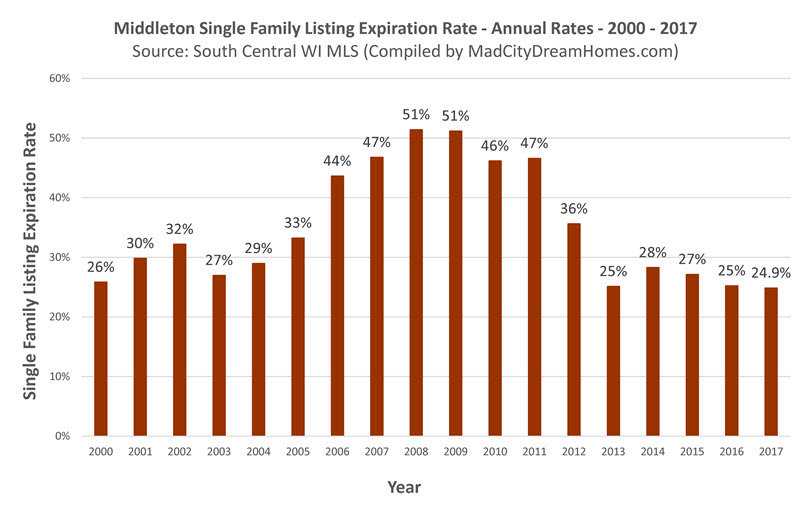
The annual Middleton single family listing expiration rate in 2017 was 24.9%. This is the lowest expiration rate on record for a single year. This is one of many indicators of a strong seller's market in Middleton.
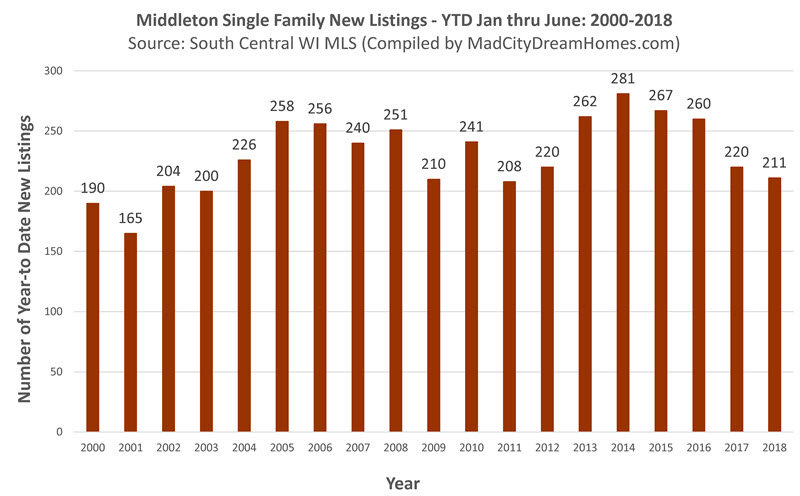
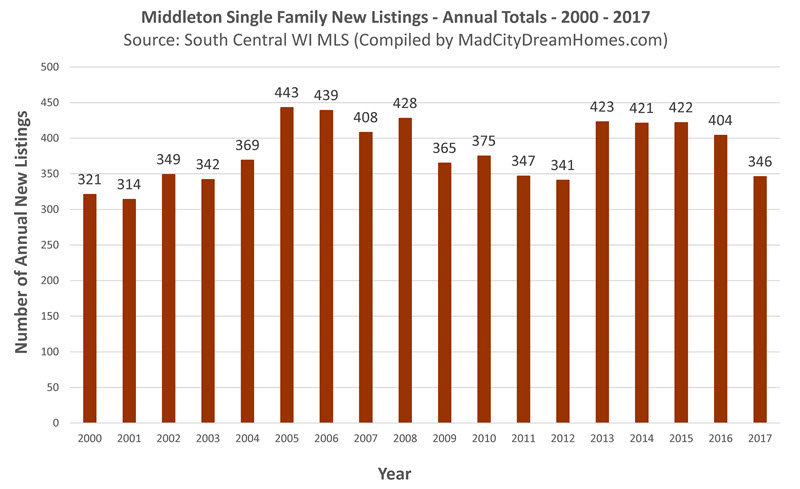
Middleton Single Family New Listings - June, 2018
Year-to-date, a total of 211 new single family home listings entered the market through the month of June, a slight decrease from last year's total at this time of 220. New construction in emerging neighborhoods has helped to maintain the supply of homes in Middleton. Without this new construction, inventory would be much lower.
A total of 346 new single family home listings entered the Middleton real estate market in 201, which is a significant decrease from the number of listings the prior year.
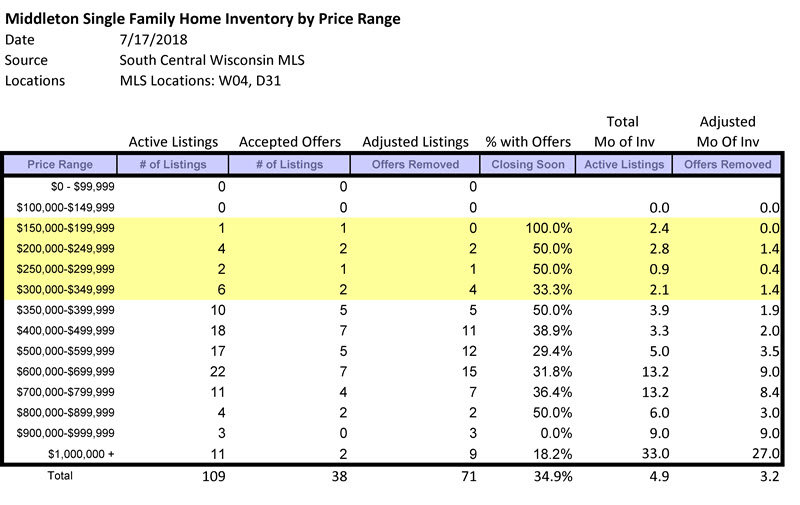
Middleton Single Family Home Months of Supply - 7/17/2018
The table below paints a good picture of the Middleton real estate market. The price ranges highlighted in yellow represent sellers' markets. As the table below shows, the inventory for these listings is very limited. As of this update there are only 7 listings priced between $150,000-$350,000 which don't have an accepted offer. On the flip side, the price categories above $350,000 have higher inventories and are more favorable to buyers. There are 3.2 months of supply available across the entire Middleton single family home market as of July 17th, 2018.
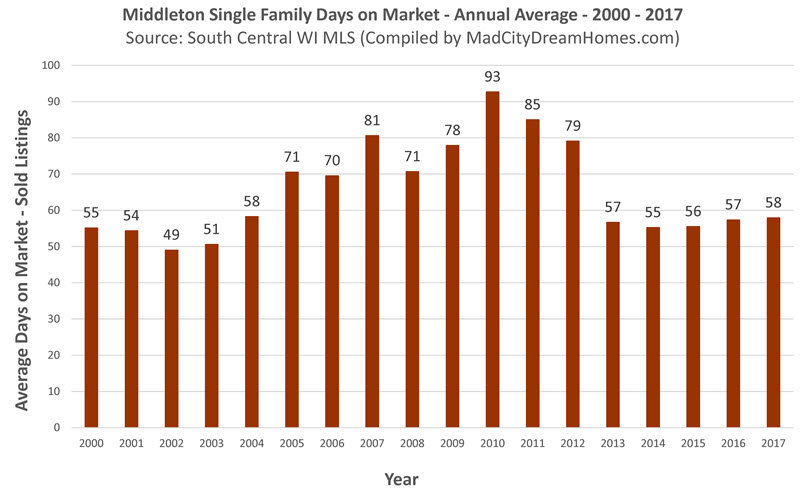
Middleton Single Family Days on Market - June, 2018
Year-to-date, the average days on market for Middleton homes through the month of June is 41 days. Single family homes are selling faster than ever recorded before due to high demand and low supply.

The average days on market for all of 2017 was only 58 days. The past 5 years there has been very little change in the average days on market in Middleton. This annual average is indicative of a good seller's market in Middleton.
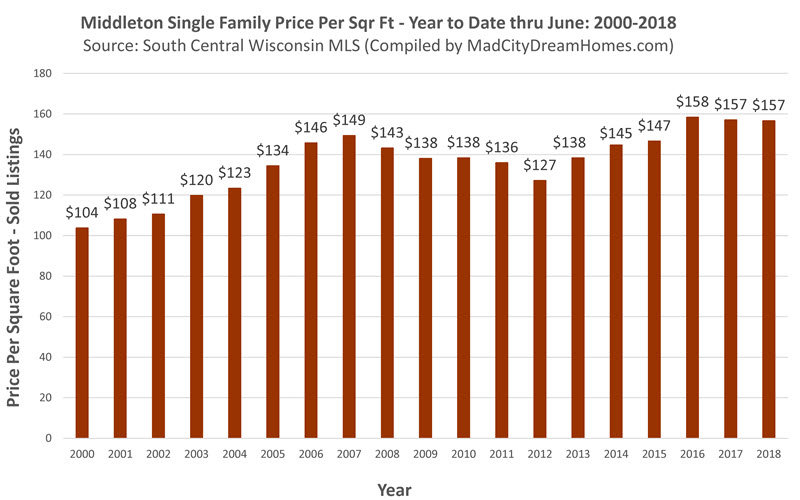
Middleton Home Prices - June, 2017
Year-to-date through June, the price per square foot is $157, for the past three years the price per square foot has been trending along the record high line. Based on current supply and demand trends, we expect the price per square foot to continue rising as more transactions are recorded throughout the year.
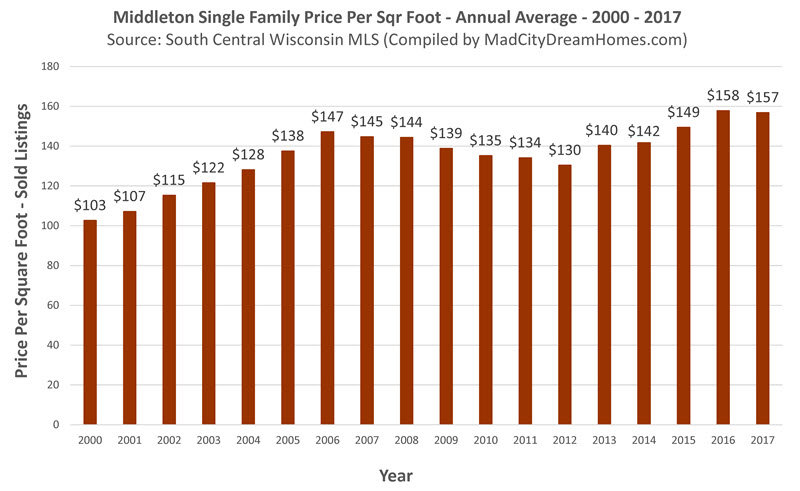
On an annual basis in 2017, the Middleton price per square foot was $157. 2017 marked the second highest annual average of price per square foot, for home in Middleton.
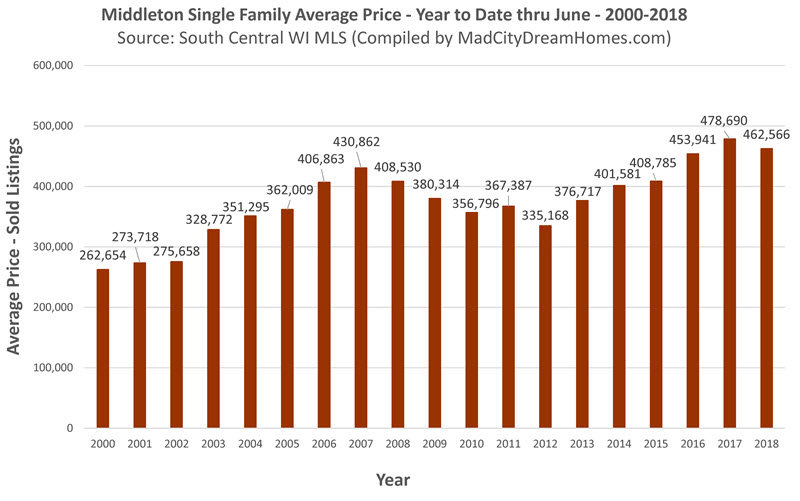
Average Middleton Home Price - June, 2018
Year-to-date, the average sales price for a Middleton single family home is $462,566,the second highest figure on record for the single family home market. The average Middleton home price has increased by about $200,000 since the year 2000.
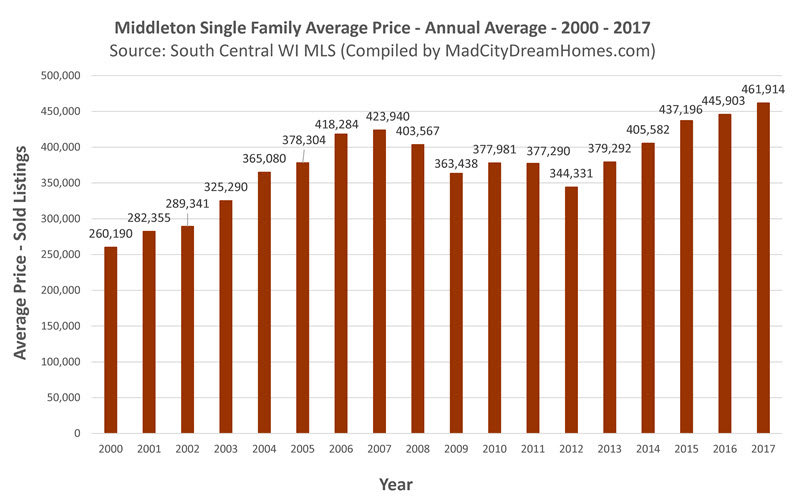
The average single family sales price for all of 2016 was $461,914. This annual average was the highest on record. Middleton home prices have set record highs 3 years in a row.
About the Author
Dan Miller is a licensed real estate agent in the State of Wisconsin. He's been helping clients buy, sell and invest in real estate since 2007. Please feel free to get in touch with Dan with any questions you have about the market in your neighborhood. Check out his blog for buying and selling tips and the latest trends in our local real estate market.