
Middleton, WI Condo Trends:
July, 2017
Our monthly report provides reliable and up-to-date information on the Middleton condo market. All of our statistics are compiled from the South Central Wisconsin Multiple Listing Service (MLS). The data in our report includes the MLS locations W04 (the city of Middleton) and D31 (the town of Middleton). With the exception of our inventory data, which is current through August 9th, all of the statistics below are updated through July, 2017.
View our report on the local single family home market here.
The Middleton Condo Market at a Glance
- Middleton condo sales are strong but also restrained by a shortage of condo inventory.
- Accepted offers are the highest in 10 years but would be higher if more inventory were available.
- Expired listings are trending near historically low levels.
- The listing expiration rate for the Middleton condo market is tied for the lowest on record. We expect the expiration to continue decreasing as we progress through the summer market.
- New condo listings increased slightly in 2017, but more are needed to satisfy buyer demand.
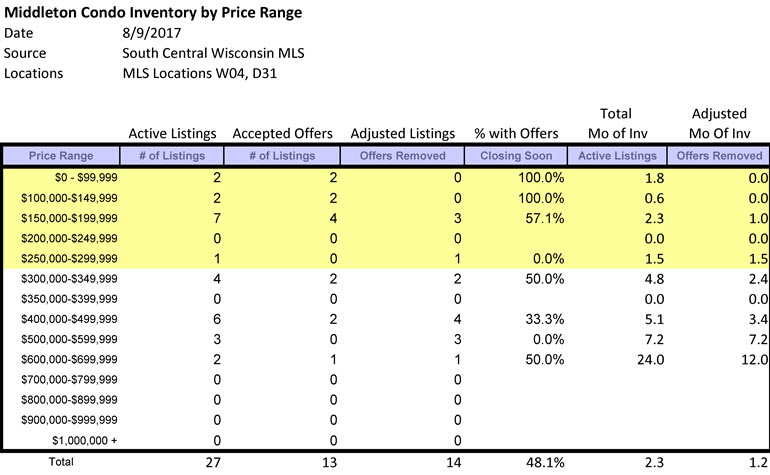
- As of 8/9/2017, 48.1% of all all listings are under contract and only 1.2 months of condo supply are available for sale. These numbers are indicative of a great sellers' market. The market is especially hot for condominiums priced under $300,000.
- The average days on market through July is 25 days - the lowest on record.
- The year-to-date average price and price per square foot are nearing the all-time high.
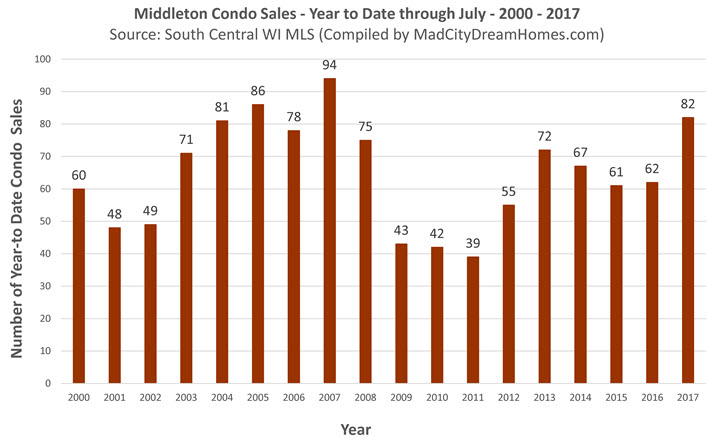
Middleton Condo Sales - July, 2017
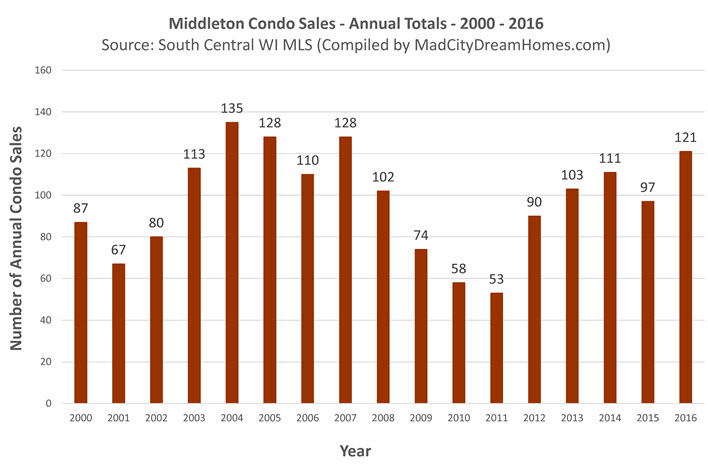
Year-to-date, a total of 82 Middleton condo listings sold via the MLS, which is the third highest year-to-date total on record. Buyer demand for condos is very strong, but a lack of supply is limiting sales in this year's market. Closings would be much higher if more condos were available for sale.
On an annual basis, a total of 121 Middleton condos sold via the MLS in 2016. This was the best year for Middleton condos since 2007, when 128 condos sold.
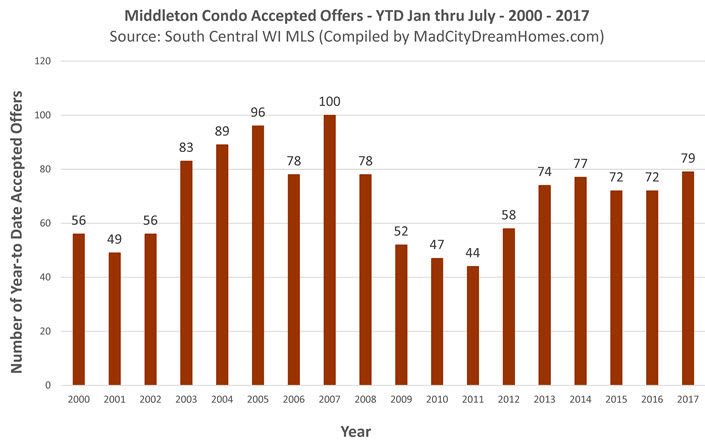
Middleton Condo Accepted Offers - July, 2017
A total of 79 Middleton condos have received accepted offers year-to-date through the month of July. This total is the highest since 2007. Demand is strong, but a lack of inventory is also limiting buyer activity in the Middleton condo market.
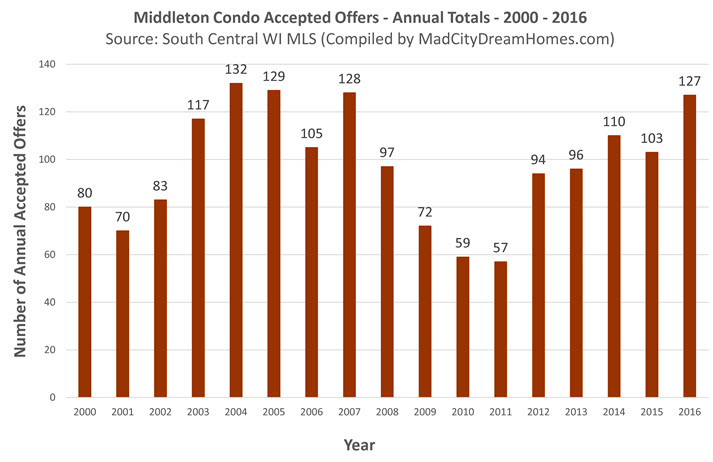
A total of 127 Middleton condos received accepted offers in 2016. This was the fourth highest total on record.
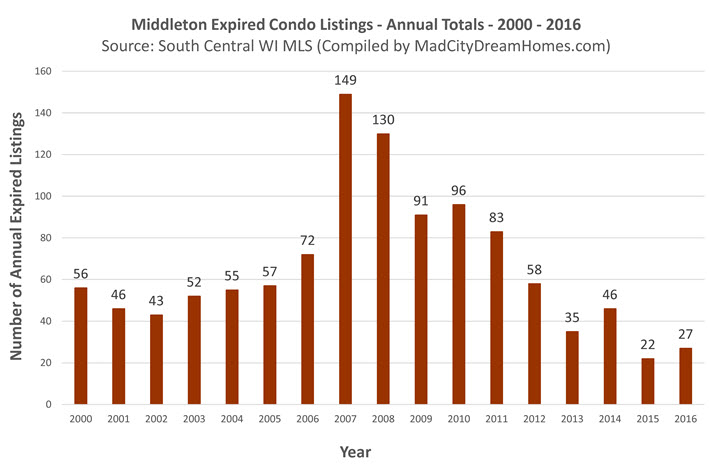
Middleton Expired Condo Listings - July, 2017
A total of 13 Middleton condos expired year-to-date through the month of July. Expired listings have decreased significantly over the last 10 years.
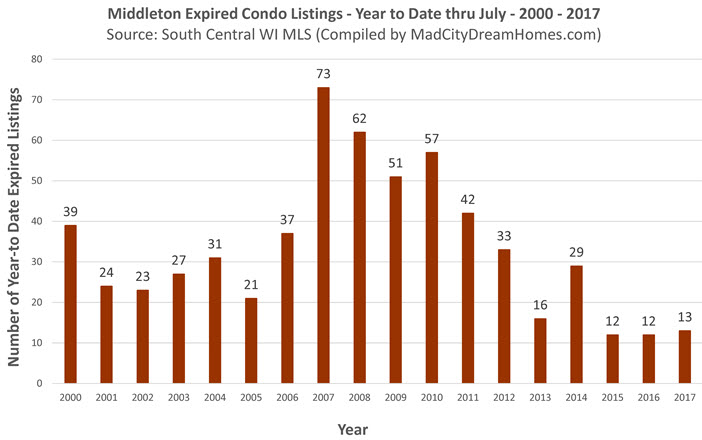
Only 27 Middleton condo listings expired in all of 2016. This represents the second lowest expired listing total on record.
Middleton Condo Listing Expiration Rate - July, 2017
The year-to-date condo expiration rate through the month of July is 14%, the lowest on record. Based on current supply and demand trends, we expect the rate to continue dropping as we progress through the rest of the 2017 sales year.
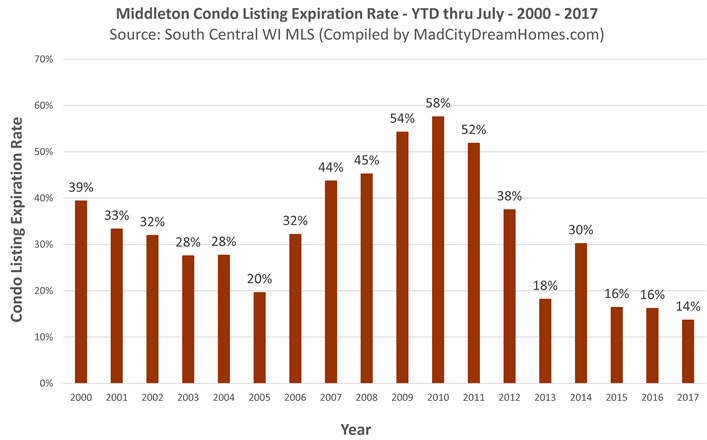
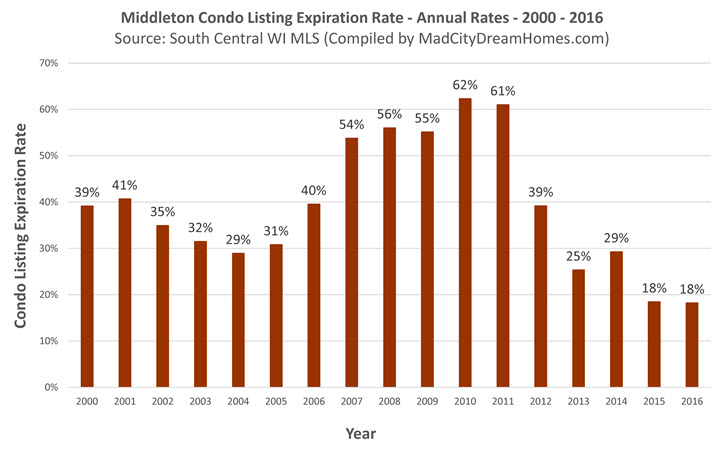
The annual condo listing expiration rate in 2016 was also 18%. This was tied with 2015 for the lowest expiration rate on record.
Middleton Condo New Listings - July, 2017
Year-to-date, 92 new listings entered the Middleton condo market through the month of July. This is higher than recent years, but it's not enough to satisfy pent up demand in the market.
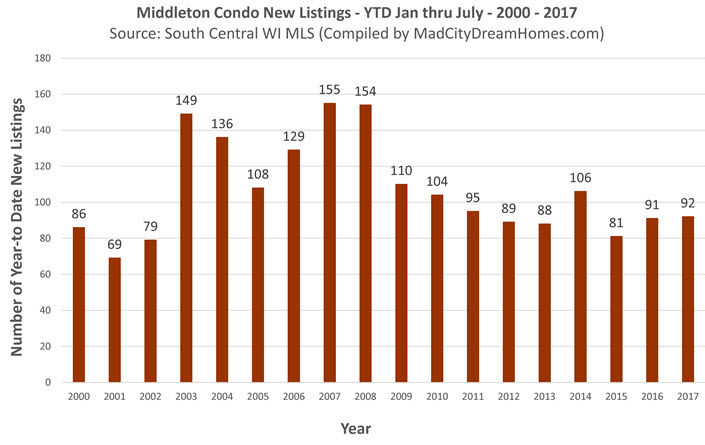
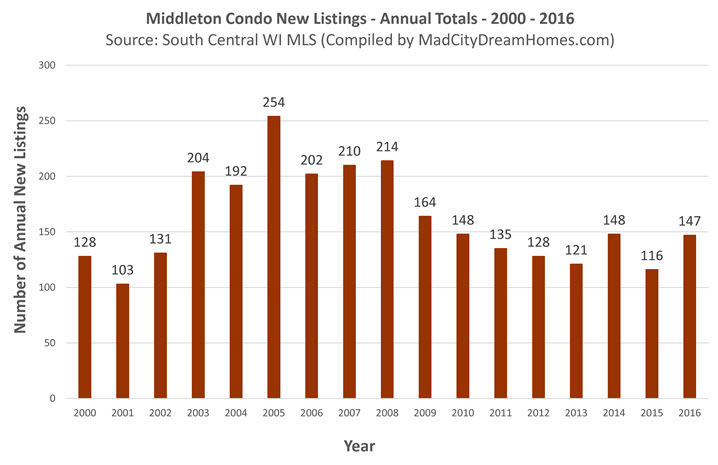
A total of 147 new listings entered the Middleton condo market in 2016. This annual total was well below the historic highs from the building boom a decade prior.
Middleton Condo Market: Months of Inventory on 7/10/17
As of 8/9/2017 there were only 3 listings priced below $300,000 without an accepted offer (see the "adjusted listings" column for the price ranges shaded in yellow). Across all price categories, only 14 condos were without an accepted offer. There is only 1.2 months of inventory available in the entire Middleton condo market (see the "adjusted mo of inv" column). This low level of supply indicates a strong sellers' market, especially for condominiums priced under $300,000.
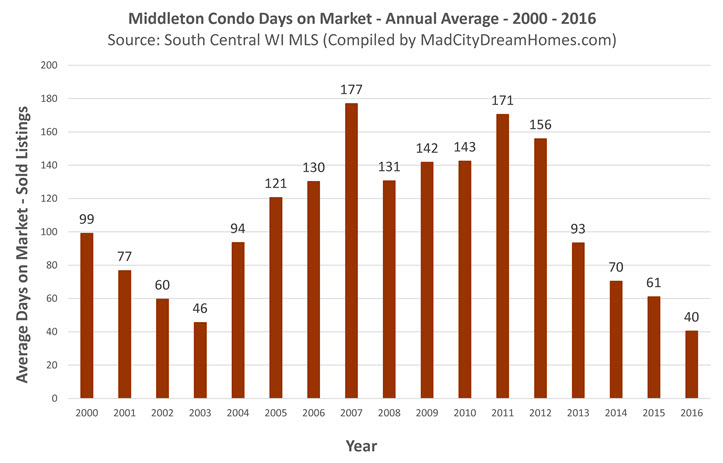
Middleton Condo Days on Market - July, 2017
Year-to-date through July, the average days on market for a Middleton condo is 25 days. This is by far the lowest year-to-date average on record.
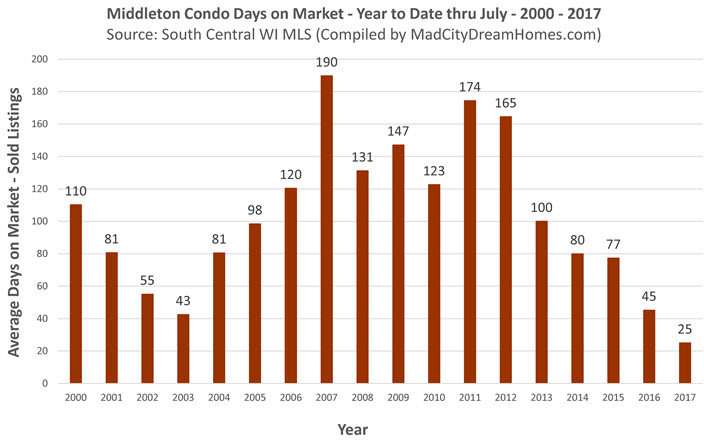
The average days on market for Middleton condos in 2016 was 40 days. This annual average was the lowest on record.
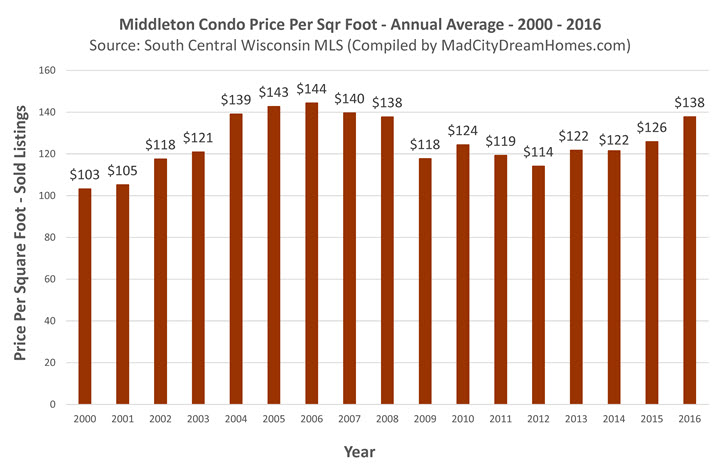
Middleton Condo Prices - July, 2017
Year-to-date through July, the average price per square foot is $143. This is the second highest on record. We expect Middleton condo prices to approach record highs by the end of the 2017.
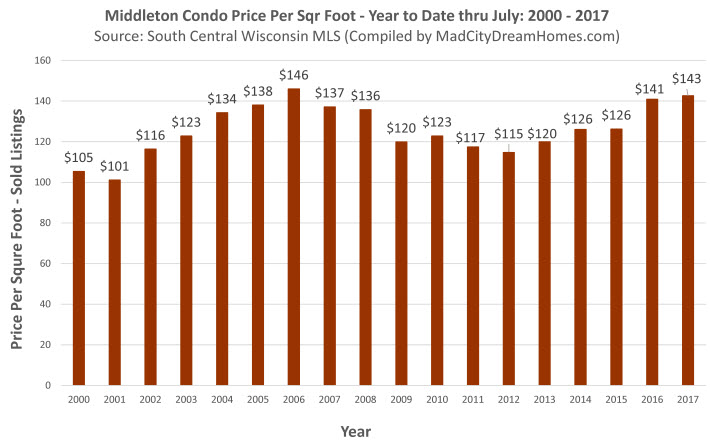
In 2016, the average price per square foot was $138. This is significantly higher than the last few years.
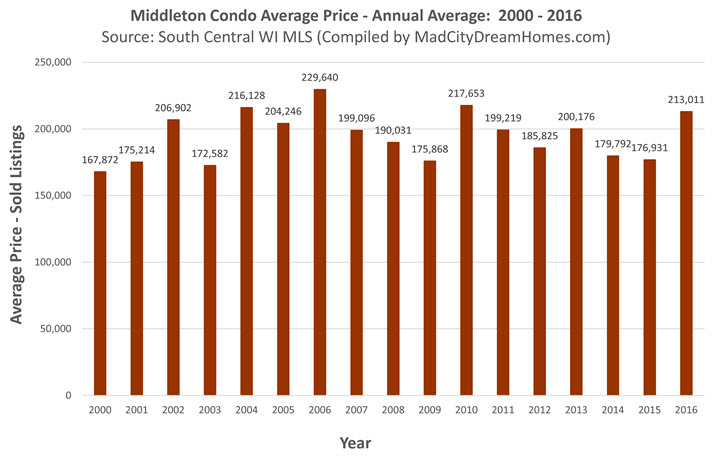
Average Middleton Condo Price: July, 2017
Year-to-date, the average selling price for a Middleton condo is $227,265. This is the second highest average price on record.
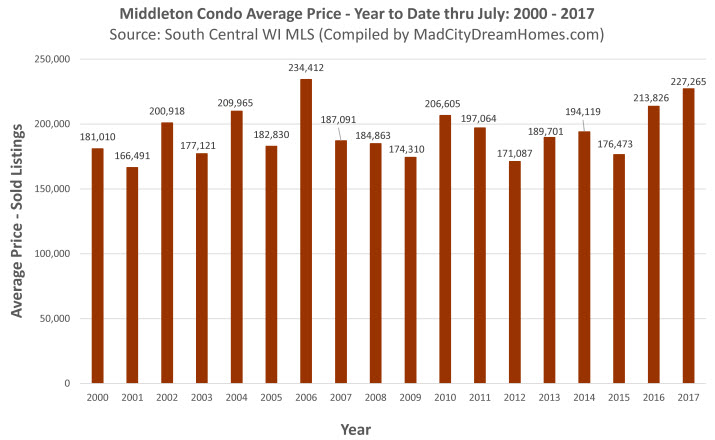
The average price for a Middleton condo for all of 2016 was $213,011. Note this price average was a reflection of available inventory. Most of the condo inventory in Middleton was for $200,000 and under. Higher priced condos were in limited supply.
About the Author
Dan Miller is a licensed real estate agent in the State of Wisconsin and a self-described "student of the market". Please feel free to call Dan at 608-852-7071 with any questions you have about the market in your condo association or your condo's current market value.