
Sun Prairie, WI Condo Report:
July, 2017
View the latest condo market trends in Sun Prairie, Wisconsin. This report covers MLS locations D45 (city of Sun Prairie) and D46 (town of Sun Prairie). All of our statistics are compiled from the South Central Wisconsin Multiple Listing Service (MLS). Unless noted otherwise, all of the statistics below are updated through July, 2017.
For our updated report on the local single family home market, click here.
Sun Prairie WI Condo Trends - July, 2017
- Condo sales increased slightly through the month of July, but they are restrained by a lack of available inventory. There is not enough supply to satisfy the demand in the Sun Prairie condo market.
- Accepted offer activity through the month of July is up slightly from last year. More contracts would have have been written if there were more condos available for sale.
- Expired condo listings are trending near record lows through the month of July.
- The listing expiration rate is at historically low levels on both a year-to-date and annual basis.
- New listings are up from last year, but they are still entering the market at a slow pace in 2017.
- As of 8/9/17, 1.3 month of supply was available for sale in the Sun Prairie condo market. This historically low inventory level is indicative of a strong sellers' market.
- Days on market are the lowest on record through the month of July.
- Sun Prairie condo prices are strong so far this year. We expect prices to approach record highs by the end of 2017.
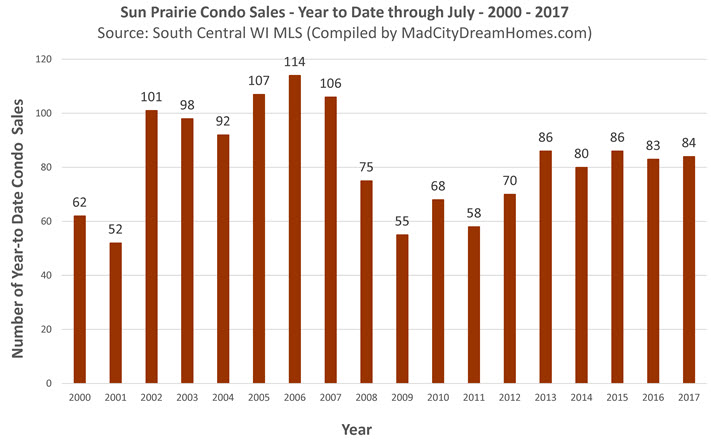
Sun Prairie Condo Sales - July, 2017
Year-to-date through the month of July, a total of 84 Sun Prairie condos sold via the South Central Wisconsin MLS. Although demand is strong, sales are restrained by low supply. Inventory trends are covered later in this report.
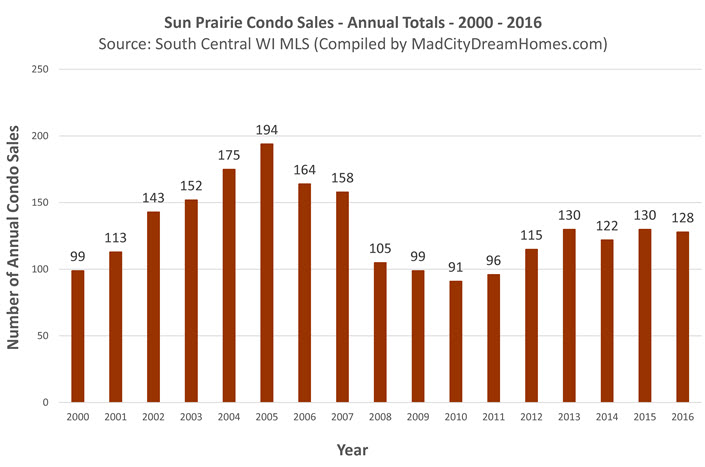
On an annual basis, a total of 128 Sun Prairie condos sold in 2016. Sales remained flat due to relatively scarce supply.
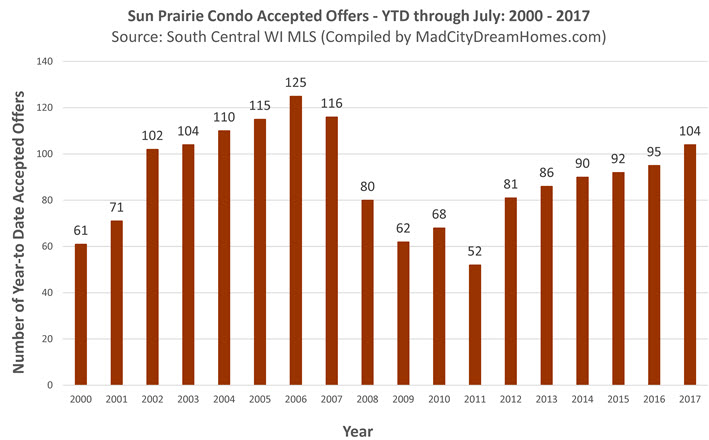
Sun Prairie Condo Accepted Offers - July, 2017
Year-to-date through the month of July, a total of 104 Sun Prairie condo listings received an accepted offer. Accepted offers are increasing, but the pace is slow due to a lack of condo supply in Sun Prairie.
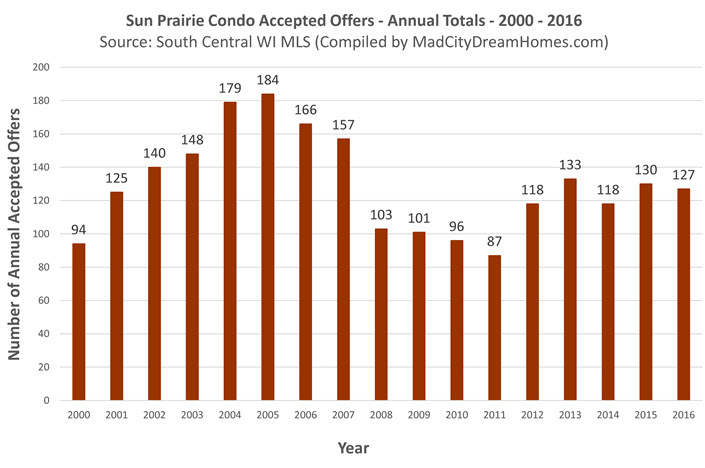
A total of 127 condo listings received accepted offers via the MLS in 2016.
<
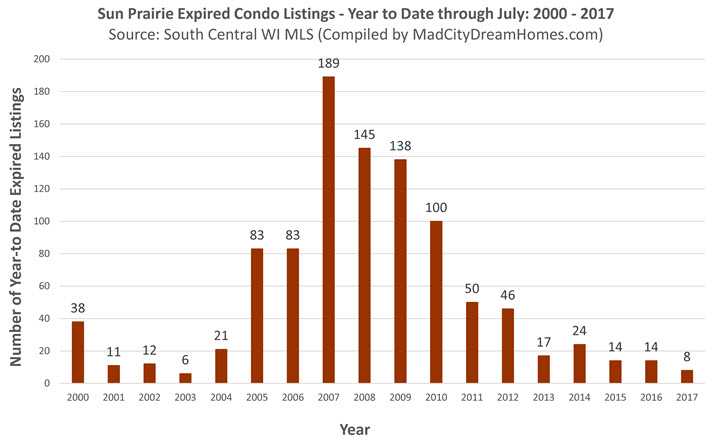
Sun Prairie Expired Condo Listings - July, 2017
Only 8 Sun Prairie condo listings have expired year-to-date through the month of July. This historically low level is indicative of a strong seller's market.
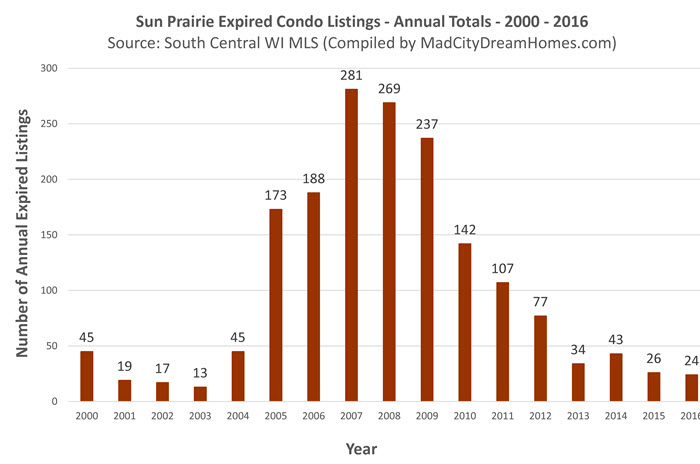
A total of 24 Sun Prairie condominium listings expired in all of 2016. This annual total was one of the lowest on record.
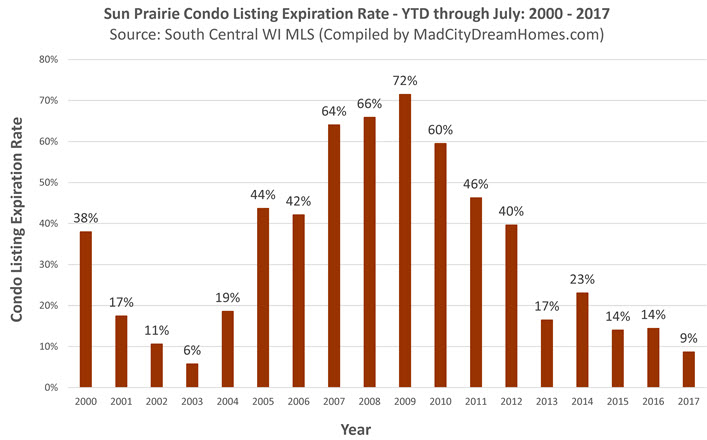
Sun Prairie Expiration Rate - July, 2017
The year-to-date expiration rate through July is only 9%, the second lowest on record. Based on current supply and demand trends, we expect the expiration rate to continue to fall as the year progresses.
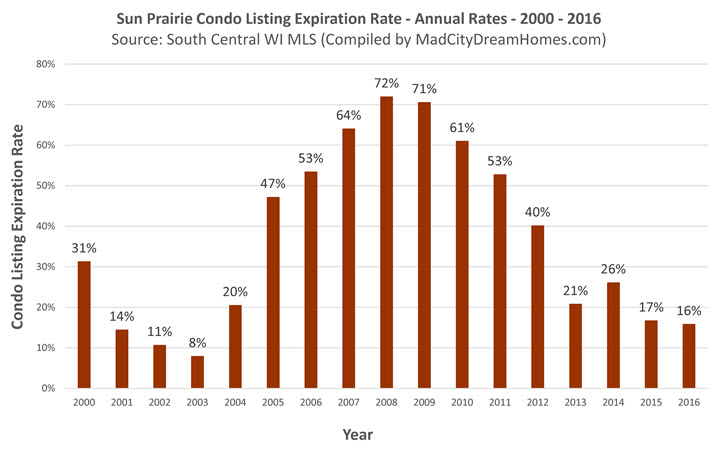
In 2016, 16% of Sun Prairie condo listings expired. This was one of the lowest rates on record. It is 4.5 times less than the peak of 72% expiration in 2008.
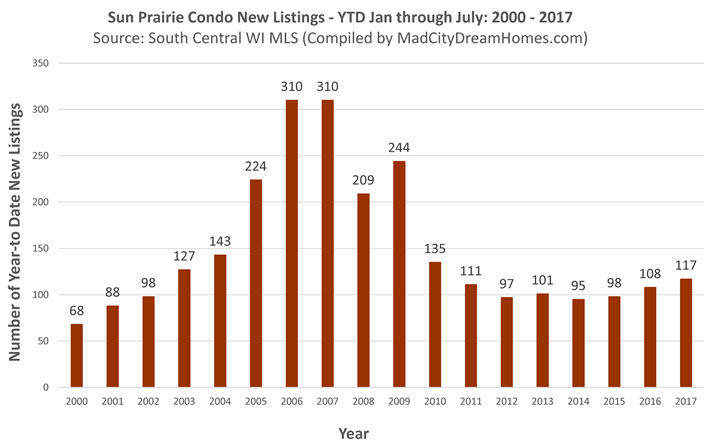
New Sun Prairie Listings - July, 2017
Year-to-date through July, a total of 117 new condo listings entered the market in Sun Prairie. As the graph below shows, new listing totals have been flat for the last 7 years.
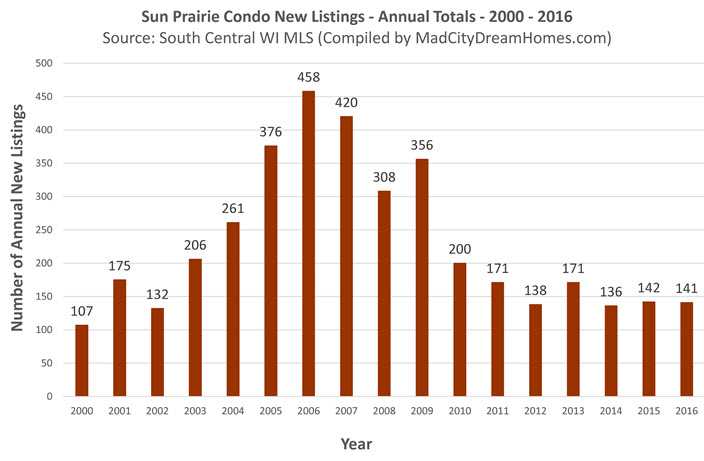
A total of 141 new MLS listings entered the Sun Prairie condo market 2016 - a low amount by historical standards.
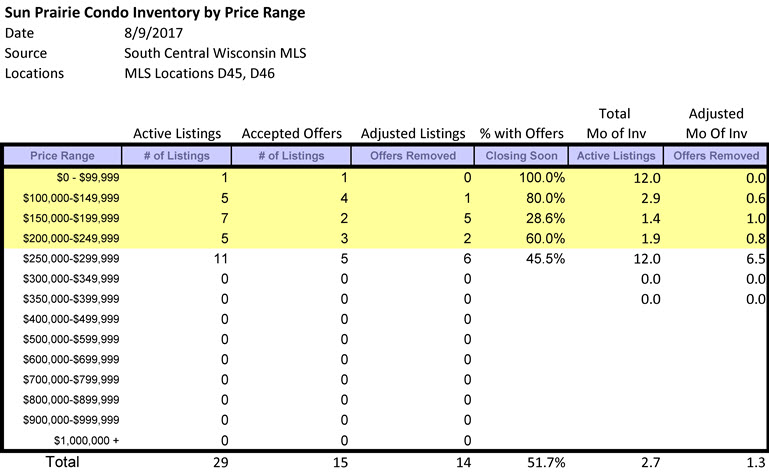
Sun Prairie Condo Inventory as of 7/12/17
This table offers some great insight into the Sun Prairie condo market. The price ranges highlighted in yellow represent the hottest segments of the market where buyer demand is highest. Overall, 51.7% of all Sun Prairie condo listings have an accepted offer. Across all price ranges, there is only 1.3 months of inventory available for sale in the Sun Prairie condo market as of August 9th, 2017.
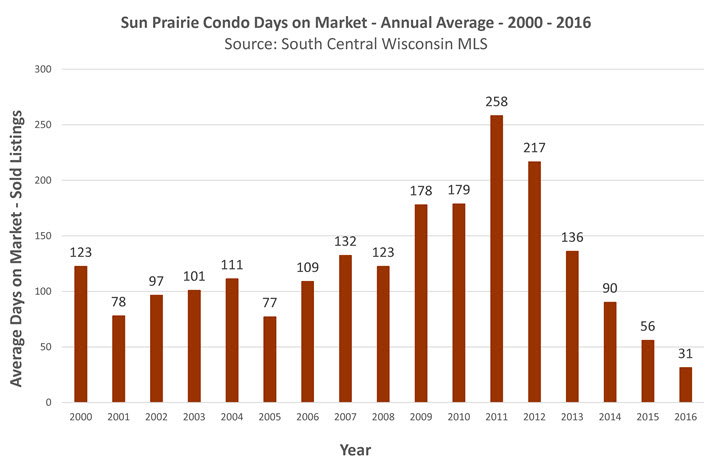
Days on Market - Sun Prairie Condos - July, 2017
Sun Prairie condos are selling at the fastest pace on record. Year-to-date through July, the average days on market is only 19 days.
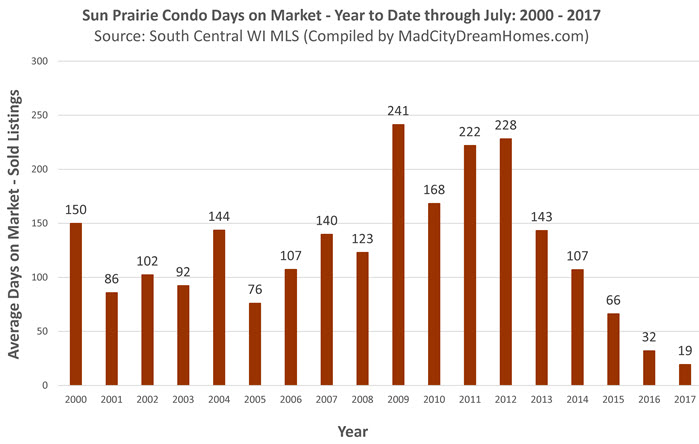
The average days on market for all of 2016 was only 31 days. This annual average was the lowest ever for the Sun Prairie condo market.
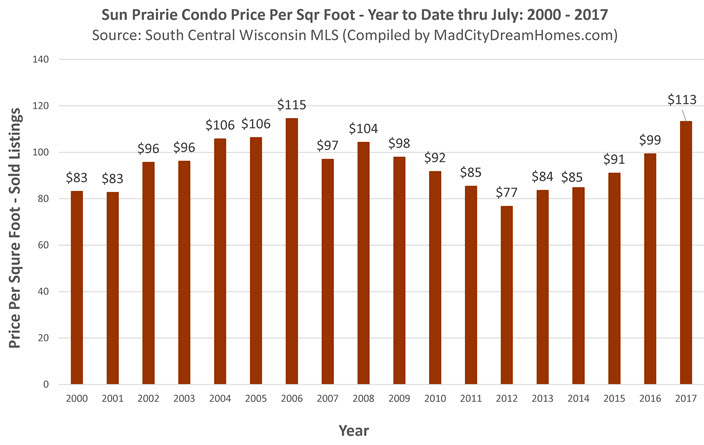
Sun Prairie Condo Prices - July, 2017
Year-to-date through July 2017, the average price per square foot for Sun Prairie single family homes is $113, just below the record high of $115 set in 2006. Price per square foot increased for the fifth consecutive year and, based on current supply and demand trends, we expect it to continue to rise throughout the rest of the year.
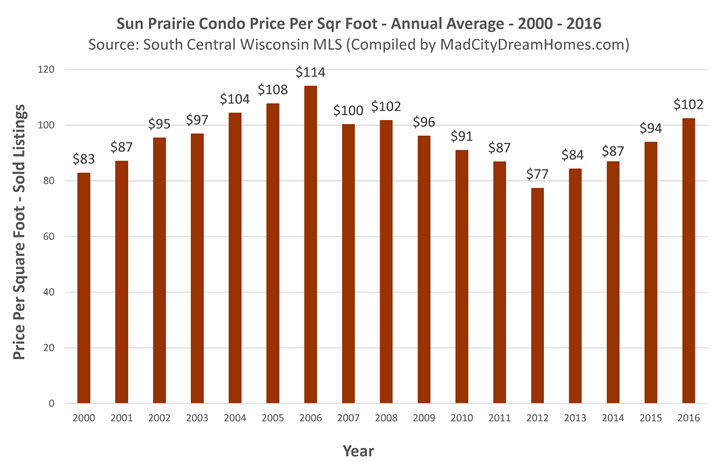
In 2016, the average Sun Prairie condo price per square foot increased for the fourth straight year. Sun Prairie condo prices bottomed out 2012 and reached a 10-year high in 2016. We expect the price per square foot to approach record highs in 2017 due to the large pent up demand for affordable housing in Sun Prairie.
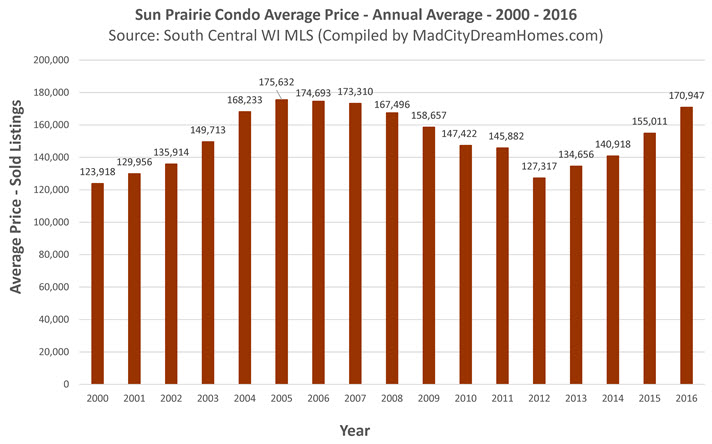
Sun Prairie WI Average Condo Price - July, 2017
Year-to-date through July 2017, the average Sun Prairie condo price is $200,944. This is the highest year-to-date average on record.
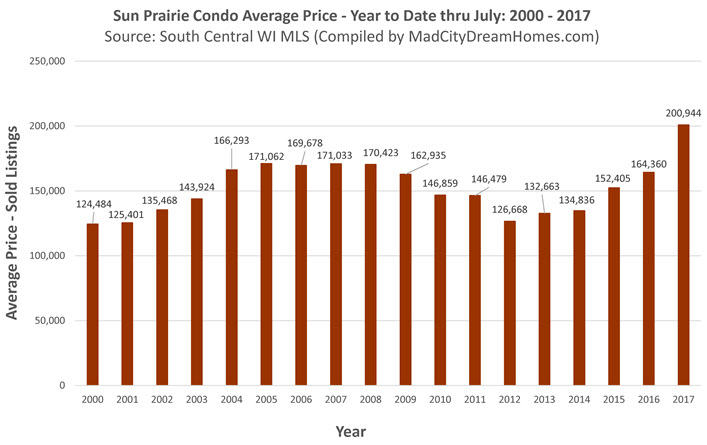
The average Sun Prairie condo price for all of 2016 was $170,947. This was the highest average in 9 years.
About the Author
Dan Miller is a full-time REALTOR with RE/MAX Preferred. Contact Dan with any questions you have about the condo market in the greater Dane County area.