
McFarland, WI Real Estate Trends:
June, 2018
Our McFarland single family home market report provides an in depth review of the real estate market in MLS area D51 (Village of McFarland). All raw data is sourced from the South Central Wisconsin MLS. All graphs, charts, statistics, and narrative are compiled by Mad City Dream Homes to provide an objective overview of the latest market conditions in McFarland.
Our June, 2018 McFarland market update follows. We refresh our report several times each year. Bookmark this page and check in often for the latest real estate trends in McFarland.
McFarland Single Family Home Trends: June, 2018
- McFarland home sales set a record highs annually in 2017 and year-to-date through June has seen a significant decrease in sales.
- Accepted offers also set record high levels for the year of 2017 and have since dropped.
- Expired listings year-to-date through June are the lowest on record and 2017 set a new annual record low. These are signs of a seller's market in McFarland.
- The single family home listing expiration rate is at a record low.
- Although inventory is low in 2018, home builders have helped maintain the supply of new listings in McFarland.
- As of 7/16/2018, 1.8 months of inventory are available in the McFarland single family home market. Inventory is especially low for homes priced below $350,000.
- The average days on market are at record low levels.
- McFarland home prices and price per square foot, through the month of June are the highest on record.
McFarland WI Sold Single Family Listings: June, 2018
Year-to-date home sales through the month of June decreased form last year, however 2018 is the second highest year on record for homes sold in McFarland through the month of June. A total of 73 McFarland homes have sold via the MLS through the month of June. Note, sales would likely be higher with more inventory.
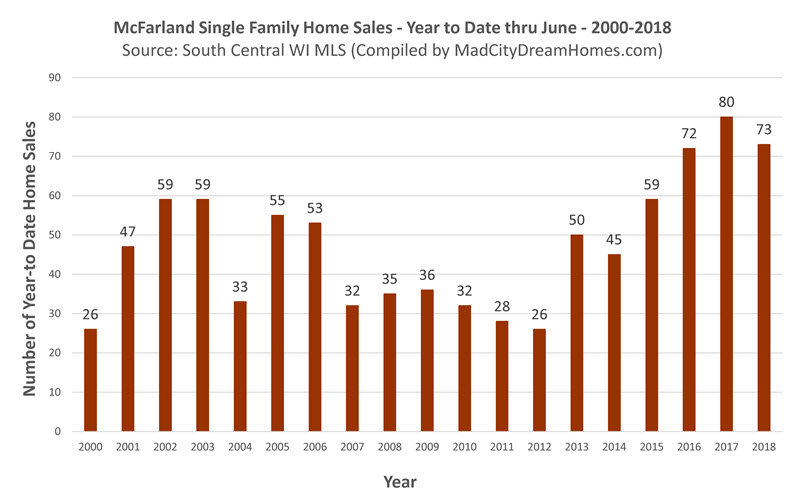
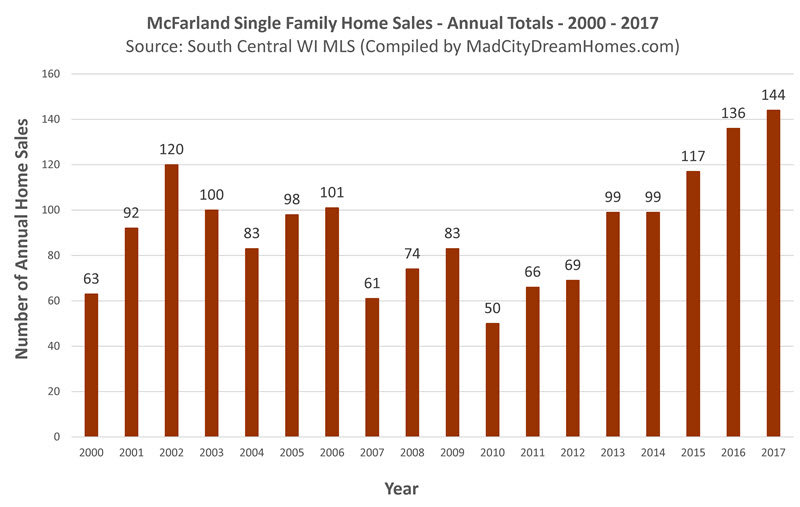
On an annual basis, 144 McFarland single family home listings sold via the MLS in 2017. This was a record high for McFarland.
McFarland Single Family Accepted Offers: June, 2018
Year-to-date through the month of June, a total of 75 McFarland single family home listings received an accepted offer. This is a significant decrease from the numbers of accepted offers at this time last year, however this total is still historically high for McFarland.
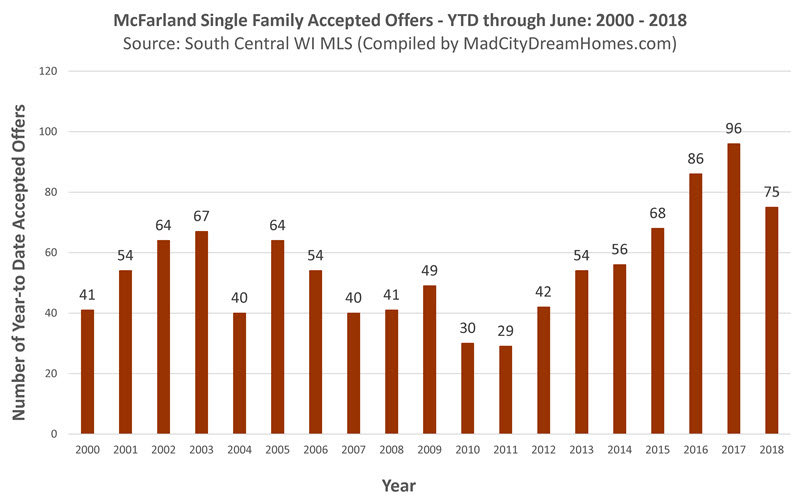
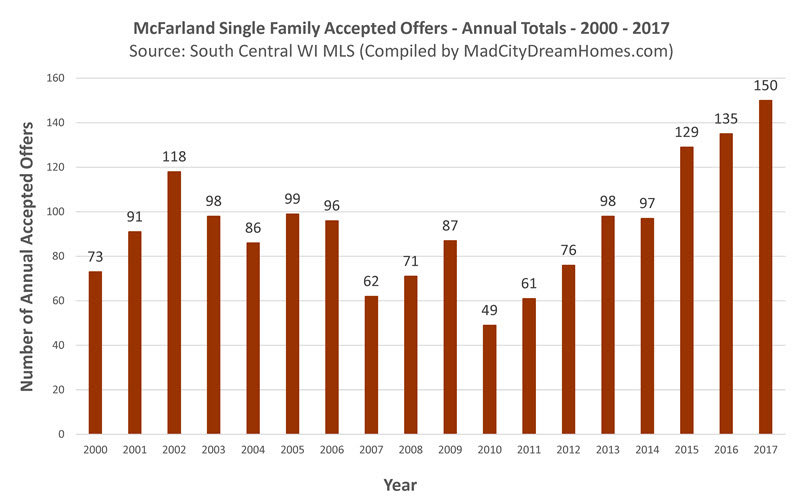
A total of 150 McFarland single family listings received an accepted offer in 2017 - a new record high.
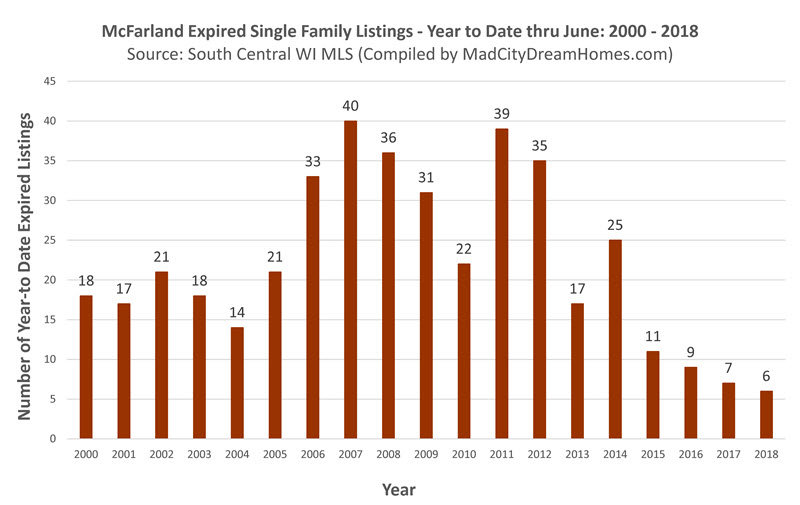
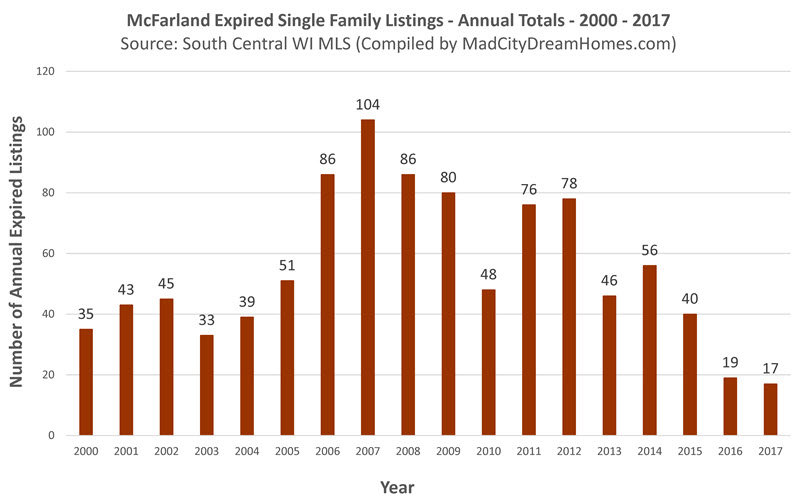
McFarland Expired Single Family Listings: June, 2018
Year-to-date through July, a total of 6 McFarland single family home listings expired on the MLS. This is the lowest figure on record.
A total of 17 McFarland single family home listings expired in all of 2017. This is the lowest figure on record, a sign of a strong seller's market in McFarland.
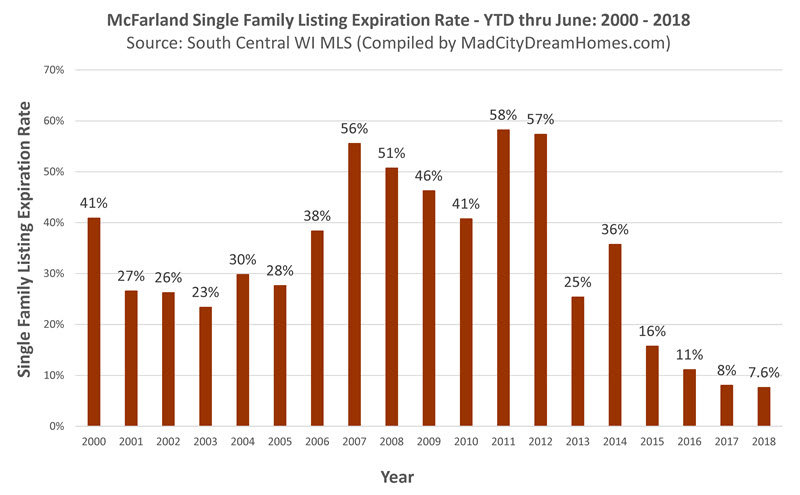
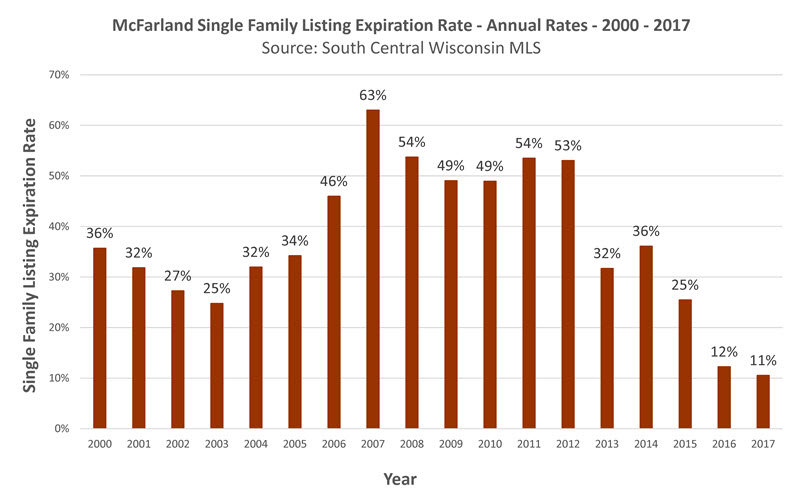
McFarland Single Family Expiration Rate: June, 2018
The year-to-date McFarland single family home listing expiration rate through June is 7.6%. This is the lowest rate on record - a sign of a much improved real estate market in McFarland.
The annual expiration rate for McFarland single family homes in 2017 was 11%.
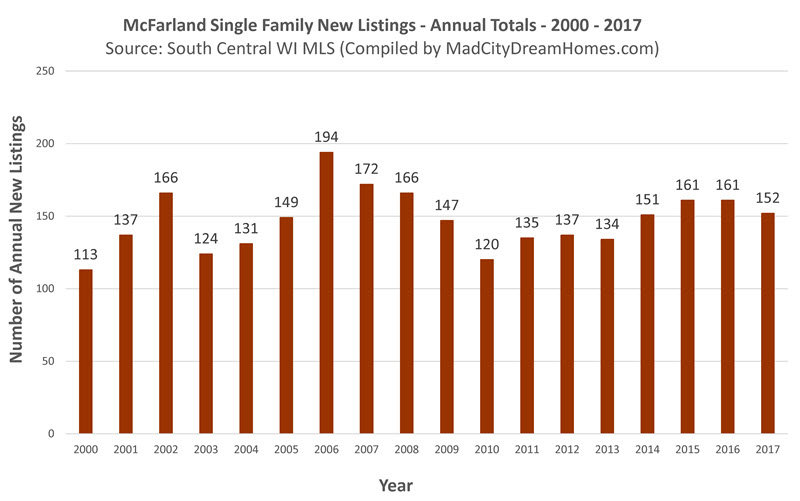
McFarland New Single Family Home Listings: June, 2018
A total of 94 new single family home listings entered the McFarland real estate market year-to-date through the month of June.
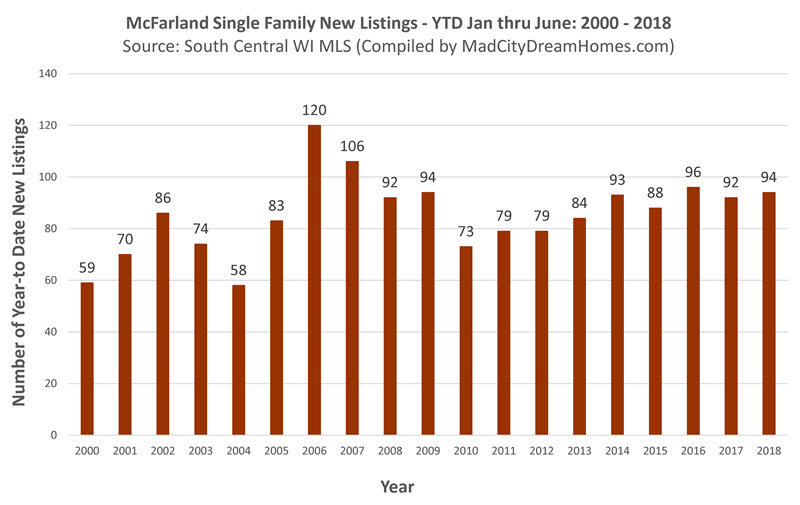
A total of 152 new single family home listings entered the McFarland single family home market in 2017. New construction has helped increase supply in McFarland, but it is not fast-paced enough to keep up with demand.
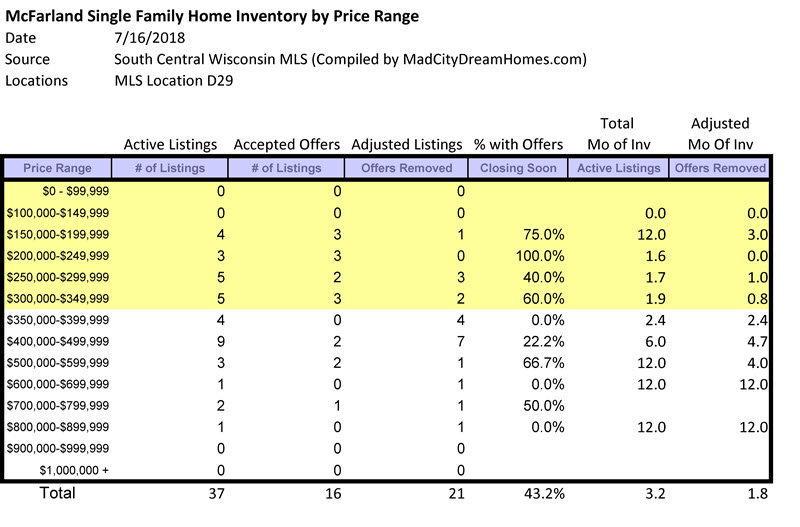
McFarland Single Family Home Months of Supply: 7/16/18
The table below provides a great overview of the McFarland real estate market by price range. The price ranges highlighted in yellow ($350,000 and under) are seller's markets. All of these price categories have 0.8 months of supply or less. The market is very strong for single family homes. Overall, there is 1.8 months of single family home supply and 43.2% of active listings have an accepted offer in McFarland as of 7/16/18.
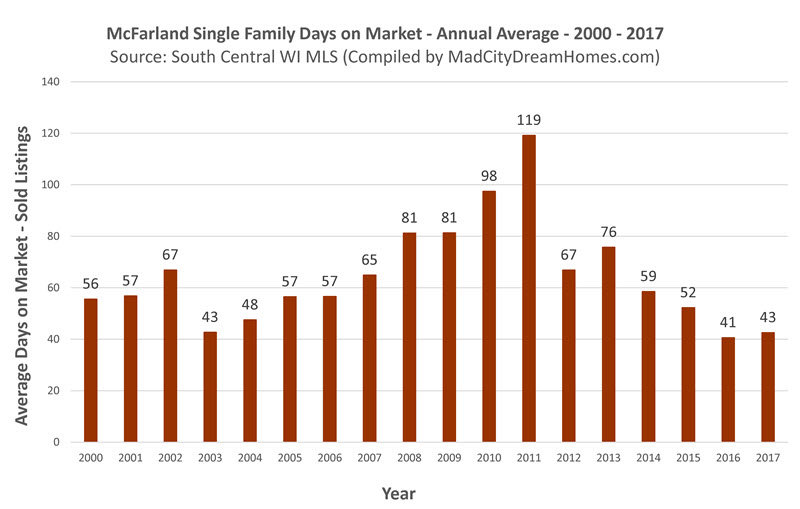
McFarland Single Family Days on Market: June, 2018
The average days on market for McFarland single family homes year-to-date through the month of June is 25 days. This is the lowest figure on record for the first 6 months of the year.
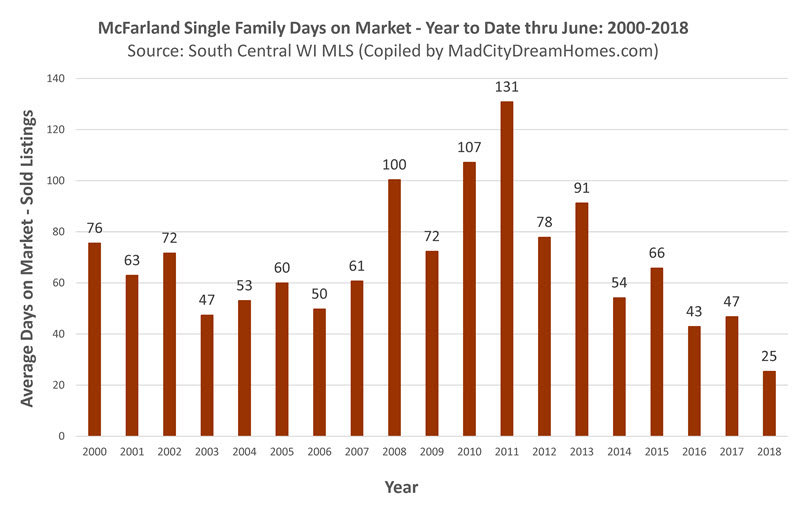
The average days on market for all of 2017 was only 43 days. This was tied for the second lowest days on market on record for McFarland.
McFarland Home Prices: June, 2018
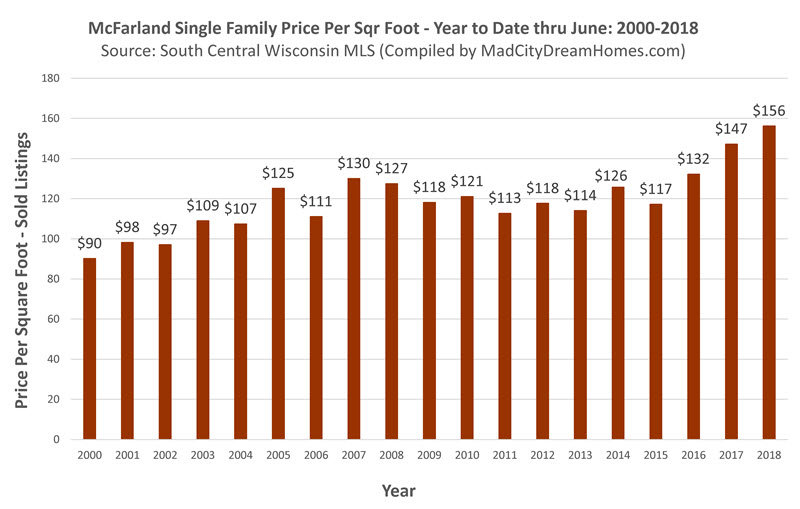
Our best statistic for measuring home value is the average price per square foot because it takes into account the size of each sold home. Year-to-date, the price per square foot through June is $156, a record high for McFarland.
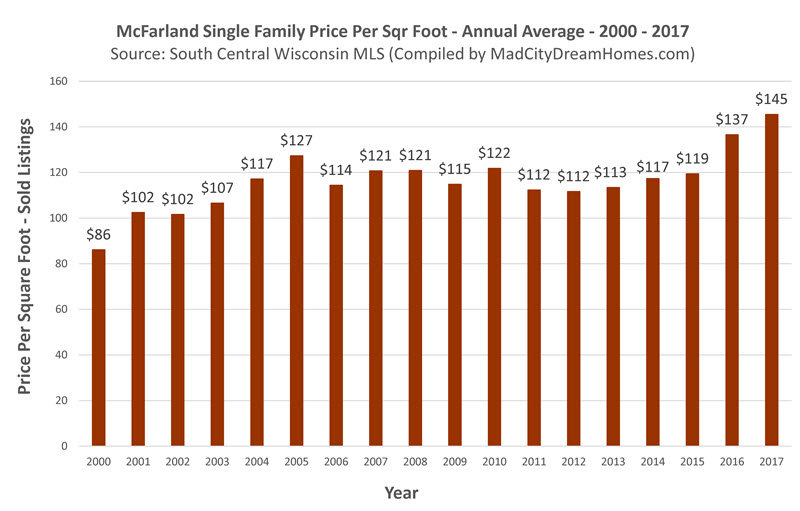
The McFarland single family home market set a new record high in 2017 at $145 per square foot.
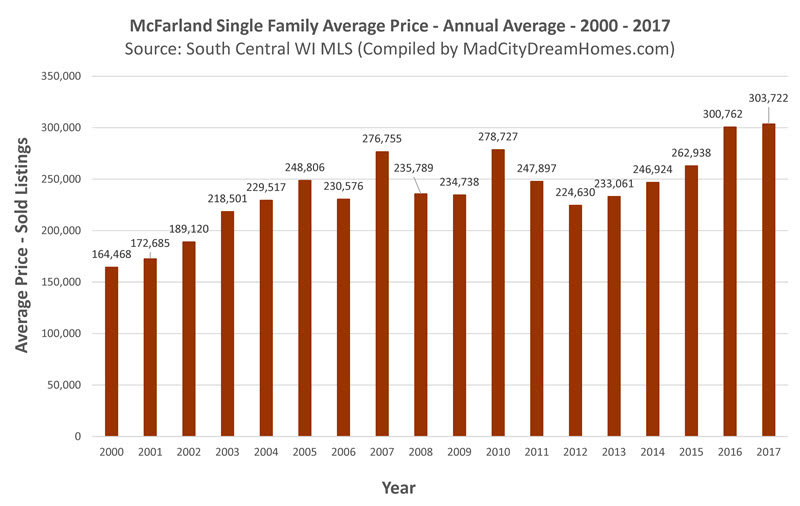
McFarland Average Price: June, 2018
Year-to-date through July, the average price is $334,129 - a new record high for the McFarland single family home market.
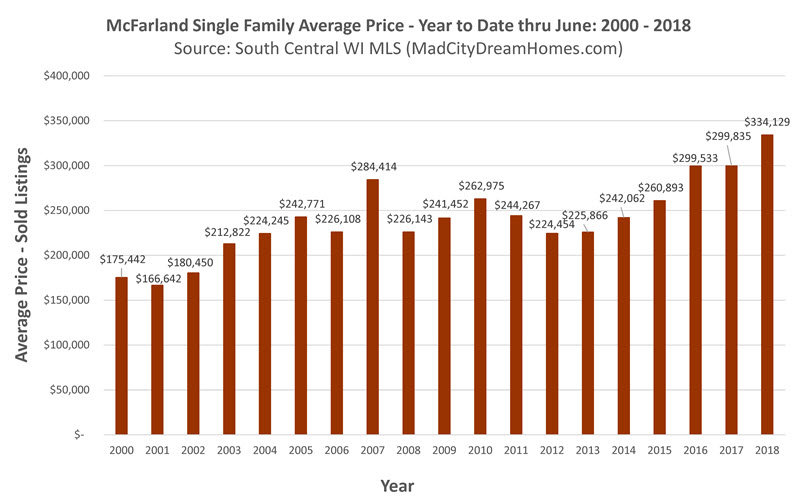
The average McFarland home price for all of 2016 was $303,722. This annual average is the highest on record.
For More on the McFarland Real Estate Market
Contact either Shelley Lazzareschi or Dan Miller to discuss market conditions in your neighborhood and an up-to-date value for your home in 2018.