
Oregon, WI Real Estate Trends:
June, 2018
The report below covers the latest price, sales, inventory, expired listing and days on market trends for single family homes in Oregon, Wisconsin. The report covers MLS location D34 (the town of Oregon) and D35 (the village of Oregon). All data comes from the South Central Wisconsin MLS database. Below is a snapshot from our June, 2018 report.
Oregon Single Family Home Market Snapshot
- Oregon home sales through the month of June are down slightly from last year. Sales would be higher if there was more inventory.
- Accepted offers decreased on a year-to-date basis but increased slightly on an annual basis.
- Expired listings year-to-date are at a record low, this is indicative of a seller's market in Oregon. Annually the number of expired listings increased from 2016 to 2017.
- The single family listing expiration rate is record low year-to-date, and 2017 had the second lowest annual rate on record.
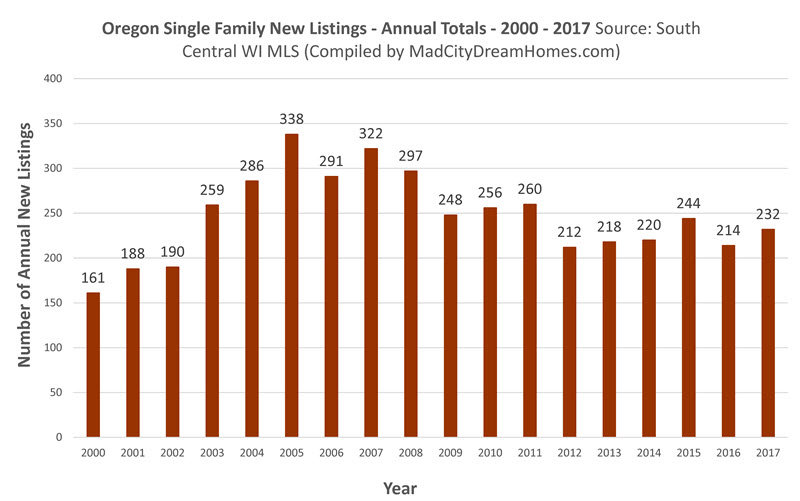
- New listings decreased slightly in 2017 from the previous year.
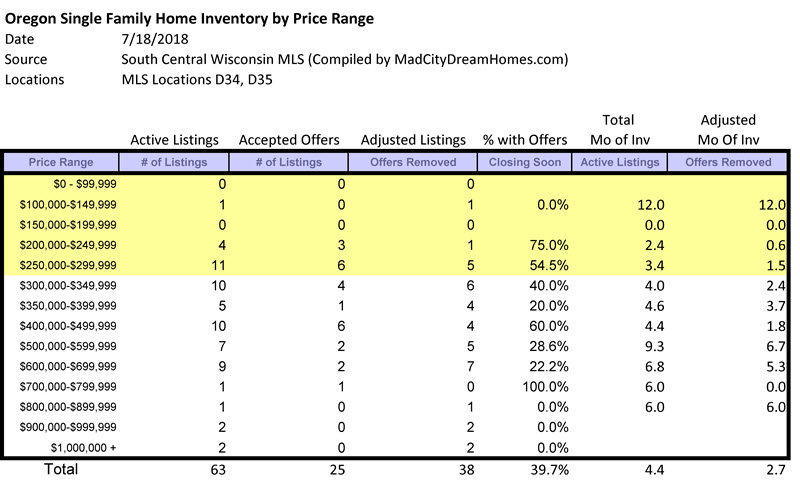
- As of 7/18/2018, there is 2.7 months of supply in the Oregon single family homes market.
- Days on market is trending along historically low levels year-to-date and annually.
- Oregon home prices continue to reflect a high demand/low inventory market. The average price and price per square foot through the month of June are at an all-time high. They are on pace to set annual record highs in 2018.
Oregon Single Family Home Sales - June, 2018
Year-to-date through June, a total of 81 Oregon single family home listings sold via the South Central Wisconsin MLS. Note, sales would be higher with more available inventory. We cover the latest inventory trends later in this report.
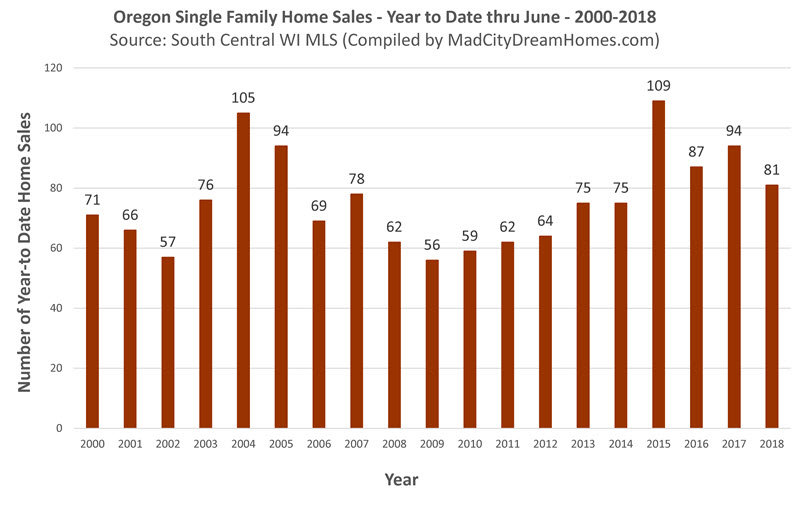
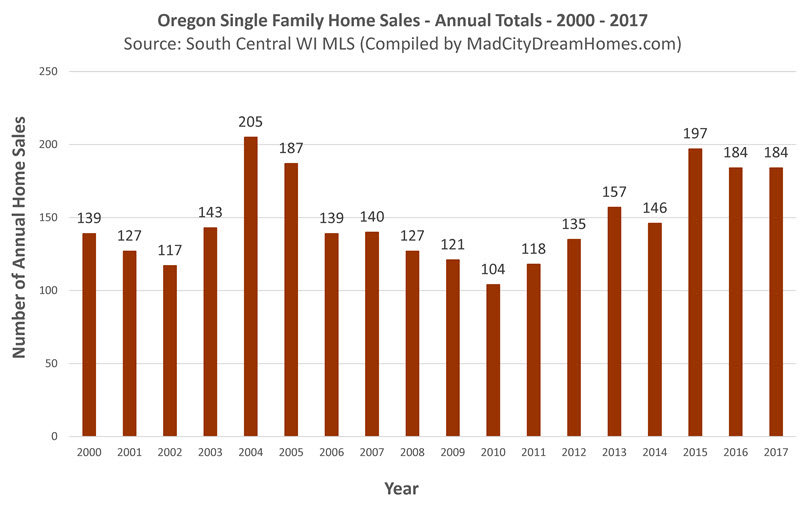
On an annual basis, a total of 184 Oregon single family listings sold in 2017, this is a historically high number of home sales for Oregon, despite the number of sales from 2017 being equal to that of the sales from 2016.
Oregon Single Family Accepted Offers - June, 2018
A total of 101 Oregon single family listings received accepted offers year-to-date. This year's total through the month of June is slightly lower than last year, but still strong by historical standards.
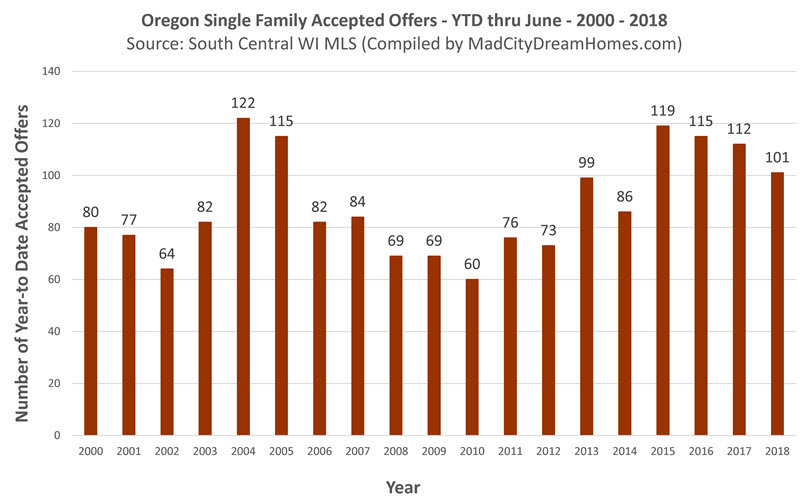
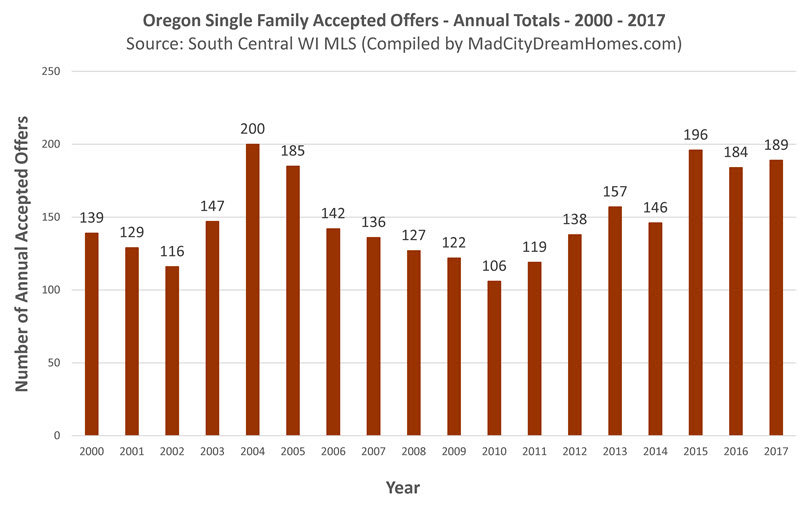
A total of 189 Oregon single family home listings received accepted offers in 2017. This was the third highest total on record.
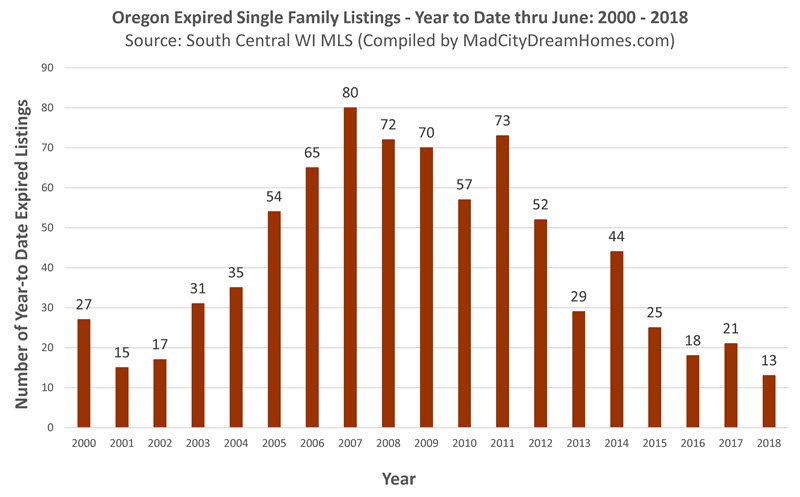
Oregon Expired Single Family Listings - June, 2018
A total of 13 Oregon single family listings expired year-to-date through the month of June. This figure is the lowest on record.
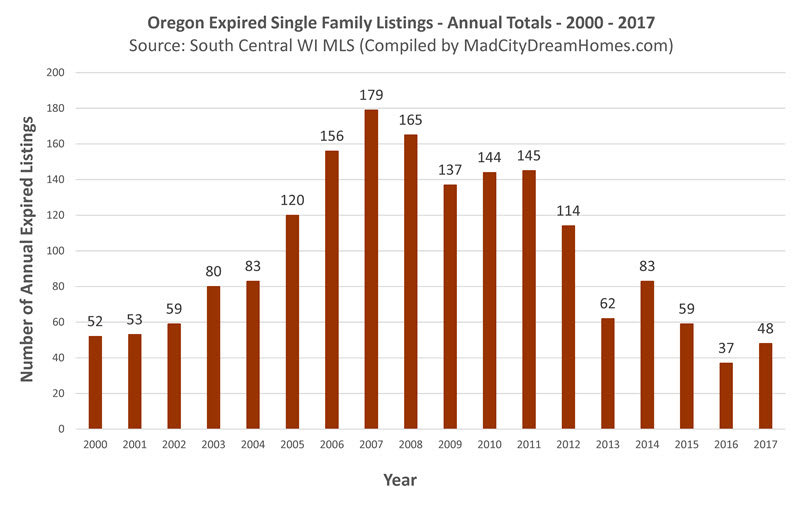
A total of 48 Oregon single family home listings expired in 2017, while this is an increase from the prior year, this figure the second lowest on record.
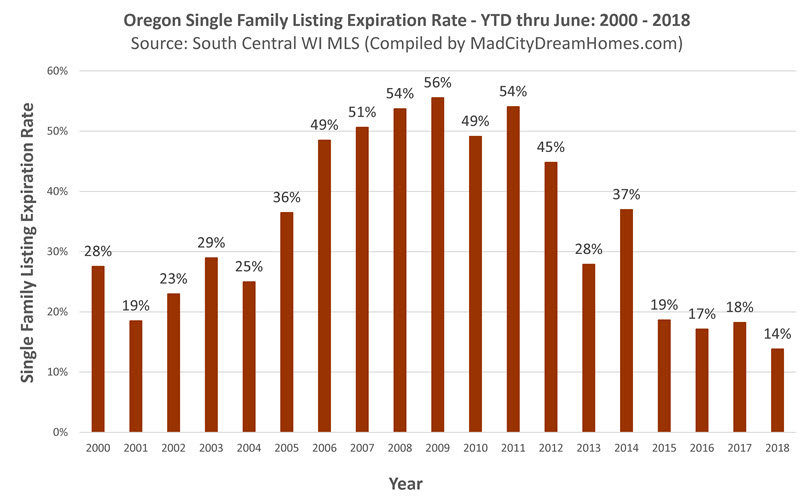
Oregon Single Family Expiration Rate - June, 2018
The year-to-date expiration rate for Oregon homes is 14% . This is the lowest figure on record through the month of June in Oregon.
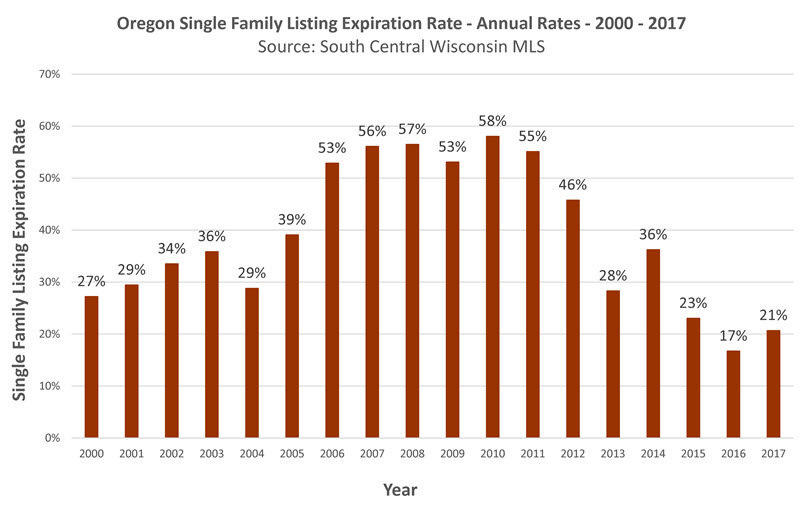
The annual Oregon single family listing expiration rate was 21% in 2017. This was an increase from the record low level of 2016, and the second lowest expiration rate on record - an indicator that Oregon has a strong seller's market.
Oregon Single Family New Listings - June, 2018
Year-to-date, a total of 127 new single family home listings entered the Oregon market through the month of June. This is a slight decrease in the number of new listings from 2016 to 2017.
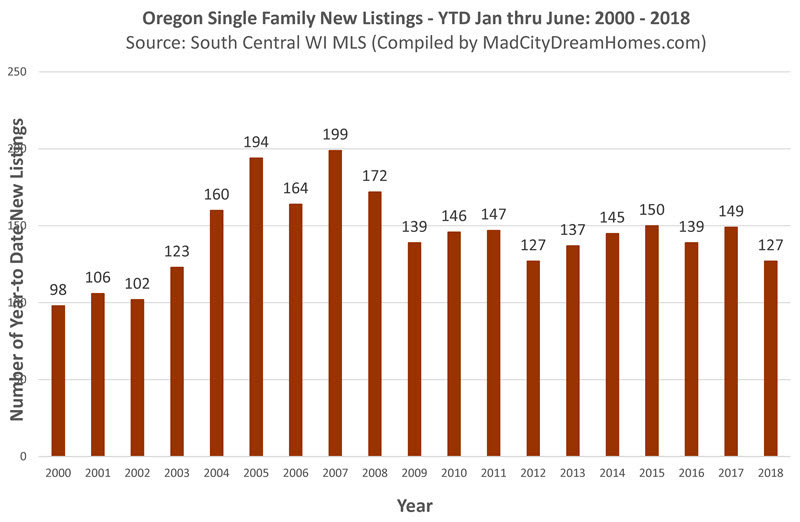
A total of 232 new single family home listings entered the Oregon real estate market in 2017.
Oregon Single Family Home Months of Supply - 7/18/2018
The table below paints a good picture of the Oregon real estate market. The price ranges highlighted in yellow represent sellers' markets. As the table below shows, in the price range below $300,000 only has a total or 8 houses that do not currently have an accepted offer. Overall, 39.7% of homes on the market have an accepted offer. There are 2.7 months of supply available across the entire Oregon single family homes market as of June 18th, 2018.
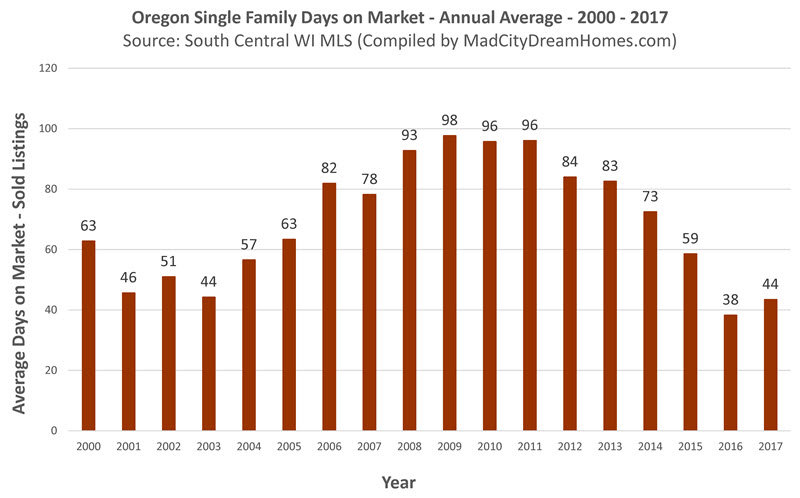
Oregon Single Family Days on Market - June, 2018
Year-to-date through June, the average time on market is 41 days, the lowest number on record. Oregon single family homes are selling quickly due to high demand and low supply.
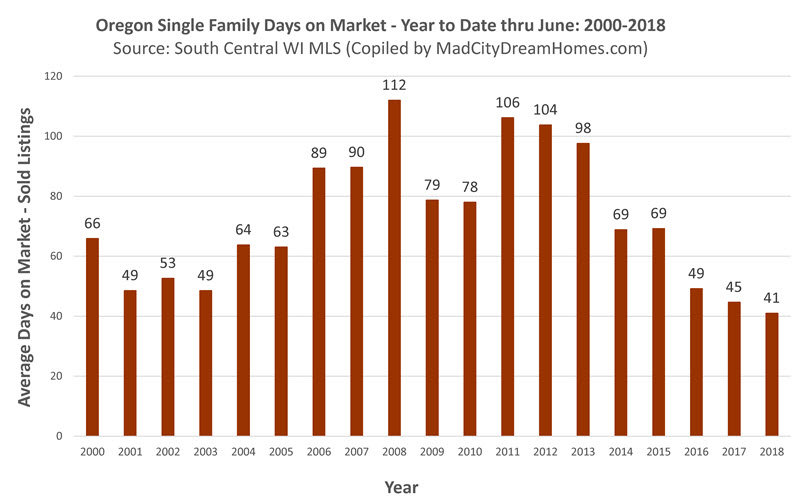
The average days on market for Oregon single family homes in all of 2017 was only 44 days, tied for the second lowest on record. This annual average is indicative of a seller's market.
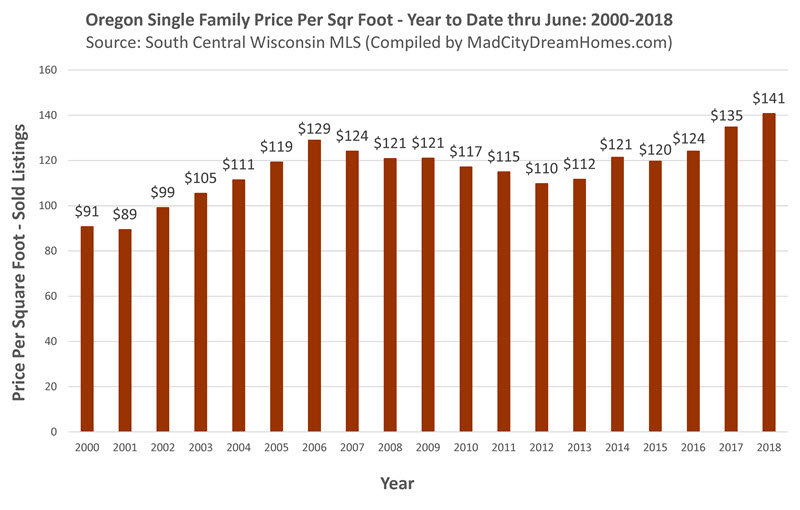
Oregon Home Prices - June, 2018
Year-to-date through June, the price per square foot is $141, a new record high in Oregon. Based on current supply and demand trends we expect the price per square foot to continue to rise throughout the remainder of the year.
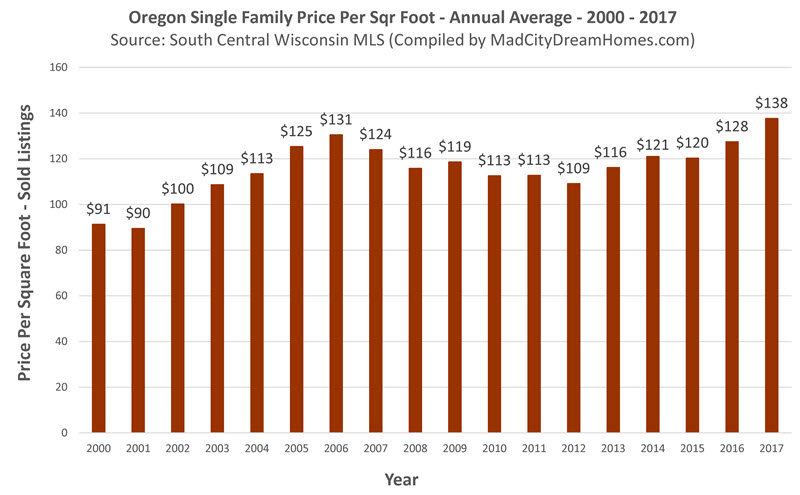
On an annual basis in 2017, the price per square foot was $138. 2017 was the highest price per square foot on record for single family homes in Oregon.
Average Oregon Home Price - June, 2018
Year-to-date, the average sales price for an Oregon single family home is $357,527. This represents a record high for the Oregon single family home market.
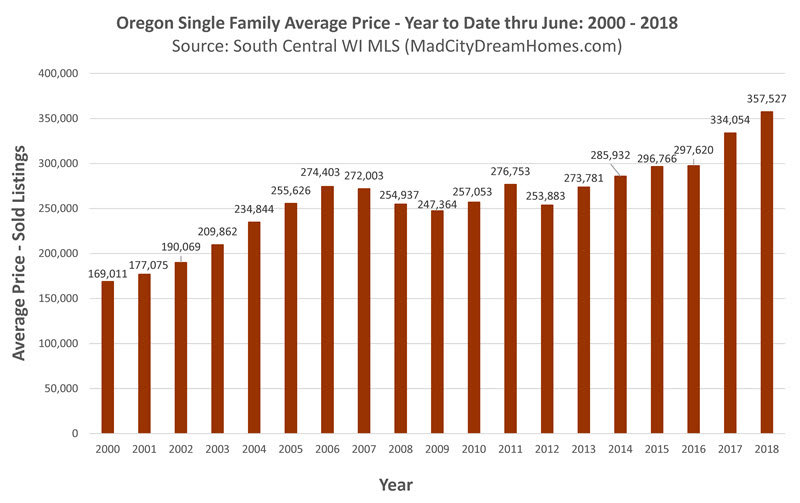
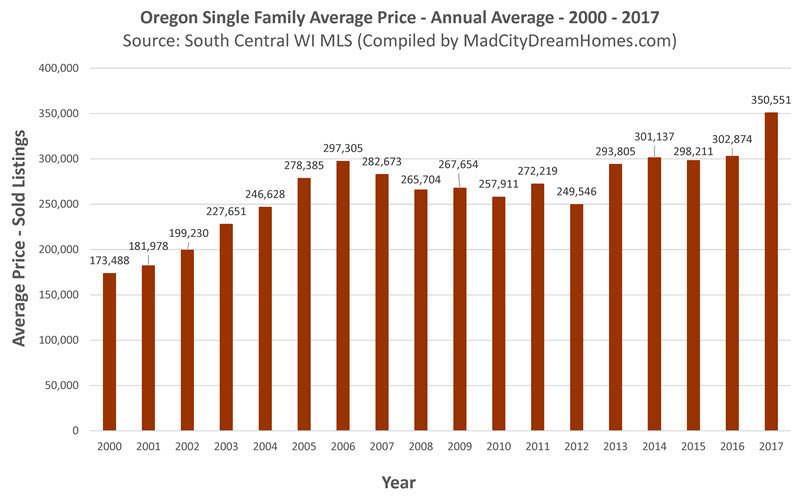
The average single family sales price for all of 2017 was $350,551. This annual average was the highest on record. Oregon home prices are on track for another record setting year in 2018.
About the Author
Dan Miller is a licensed real estate agent in the State of Wisconsin. He's been helping clients buy, sell and invest in real estate since 2007. Please feel free to get in touch with Dan with any questions you have about the market in your neighborhood. Check out his blog for buying and selling tips and the latest trends in our local real estate market.