
Madison, WI Condo Market Trends:
May, 2020
This report provides objective information on the latest condo market trends in Madison, Wisconsin. The city of Madison represents the largest market in South Central Wisconsin, and serves as a good indicator for the market across all of Dane County. All of our statistics are compiled from the South Central Wisconsin Multiple Listing Service (MLS). Unless noted otherwise, all of the statistics below are updated through May, 2020.
For our monthly report on the single family home market, click here. View all Madison condos for sale here.
Madison WI Condo Market Summary - May, 2020
- Madison condo sales were down 32% in May and 14% year-to-date. Low inventory is limiting condo sales in 2020.
- Accepted offers are also trending lower.
- Expired listings continue to trend near historically low levels through May of 2020.
- The Madison condo listing expiration rate through the month of May is very low by historical standards.
- New condo listings are entering the market at a slow pace through the first 5 months of 2020.
- As of 6/6/2020, there are 1.5 months of supply available in the local condo market. Inventory is especially tight in the under $250,000 market.
- The average condo days on market through the month May was very low by historical standards.
- Madison condo prices (price per square foot) reached a record high in the month of May. The average price also reached an all-time high.
- Competing offers in 2019 ended the year at 32% - an all-time high.
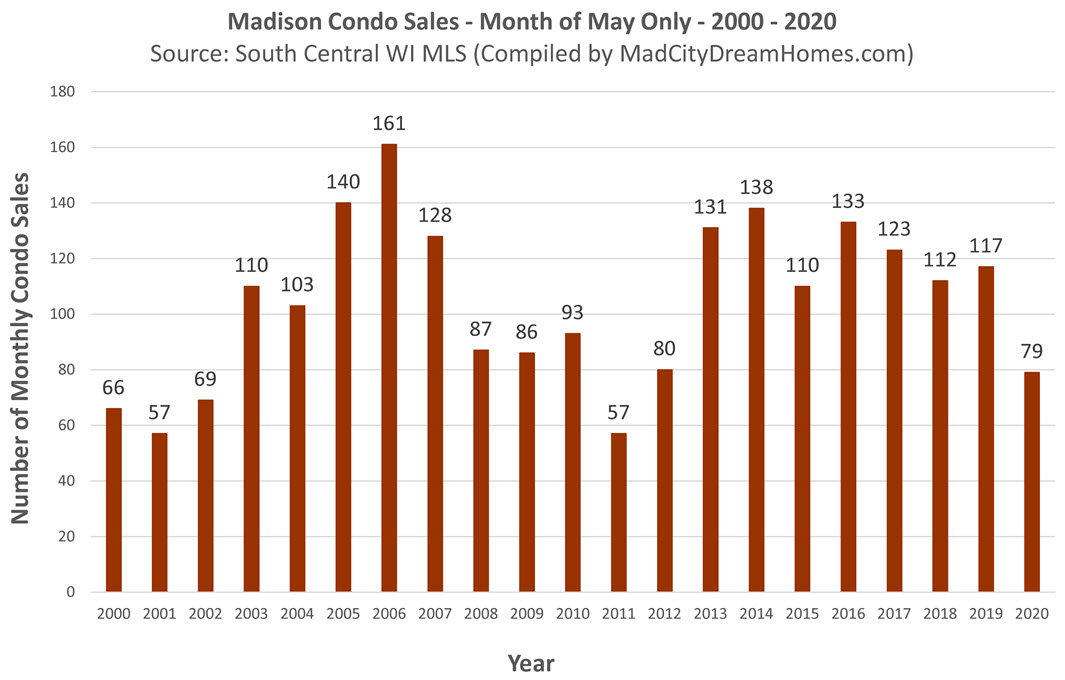
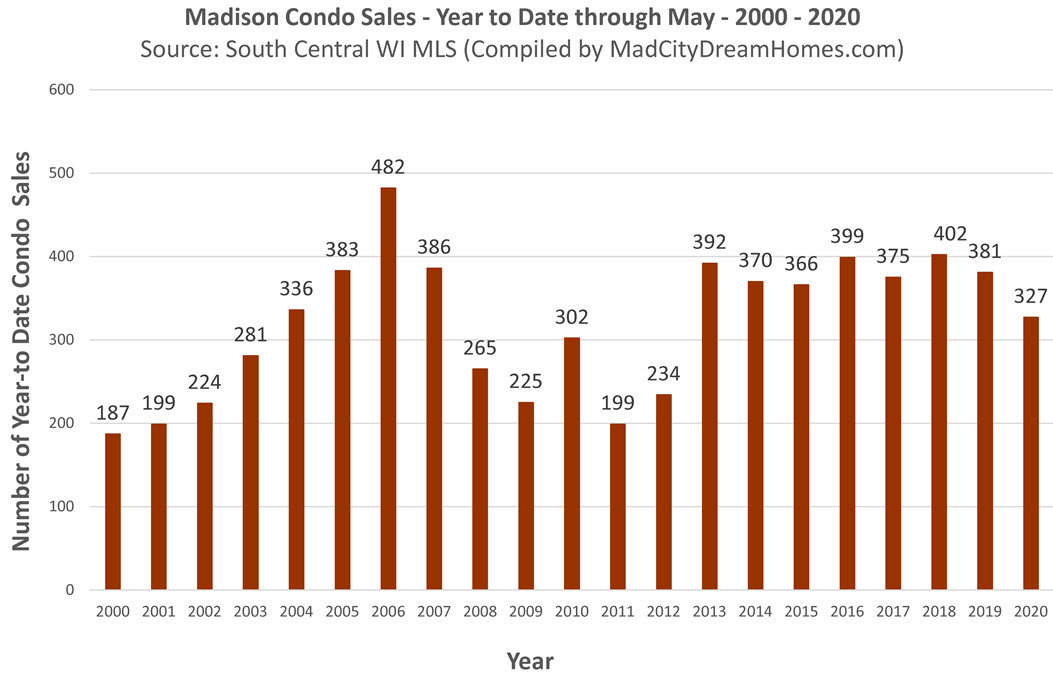
Madison WI Condo Sales - May, 2020
A total of 79 Madison condos sold via the MLS in the month of May, which was the lowest total for the month since 2011. Fewer condos are being listed for sale this yer, which will limit the number of condos sold in 2020.
Year-to-date through May, a total of 327 Madison condo listings sold via the MLS, down 14% from the year before.
On an annual basis, a total of 968 Madison condo listings sold in 2019. Sales were limited by low supply.
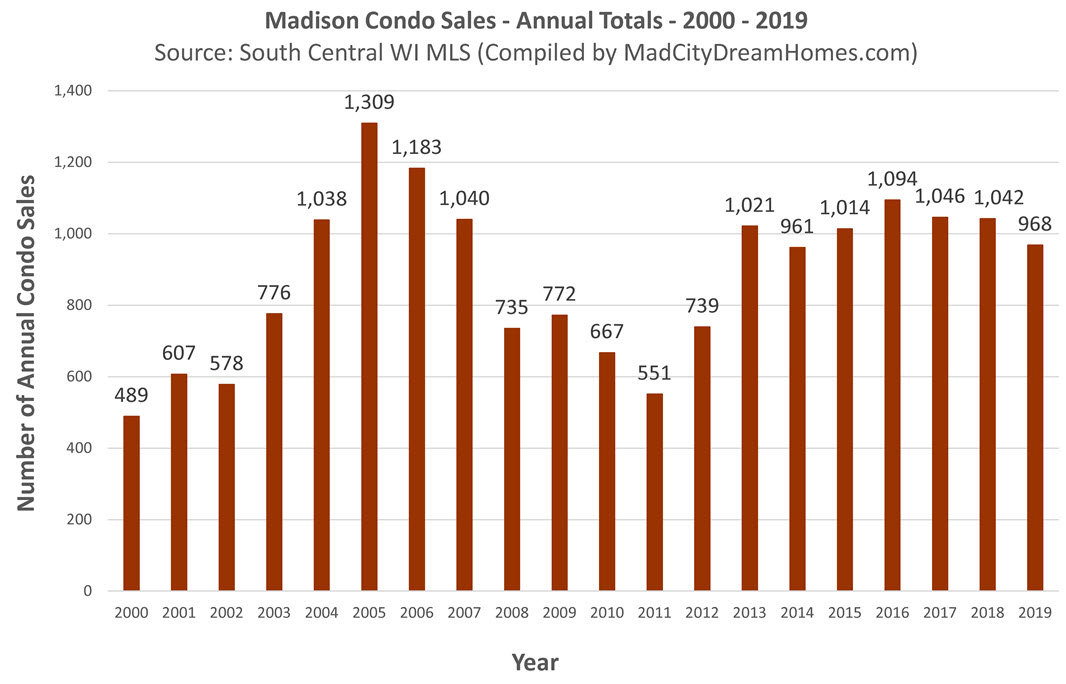
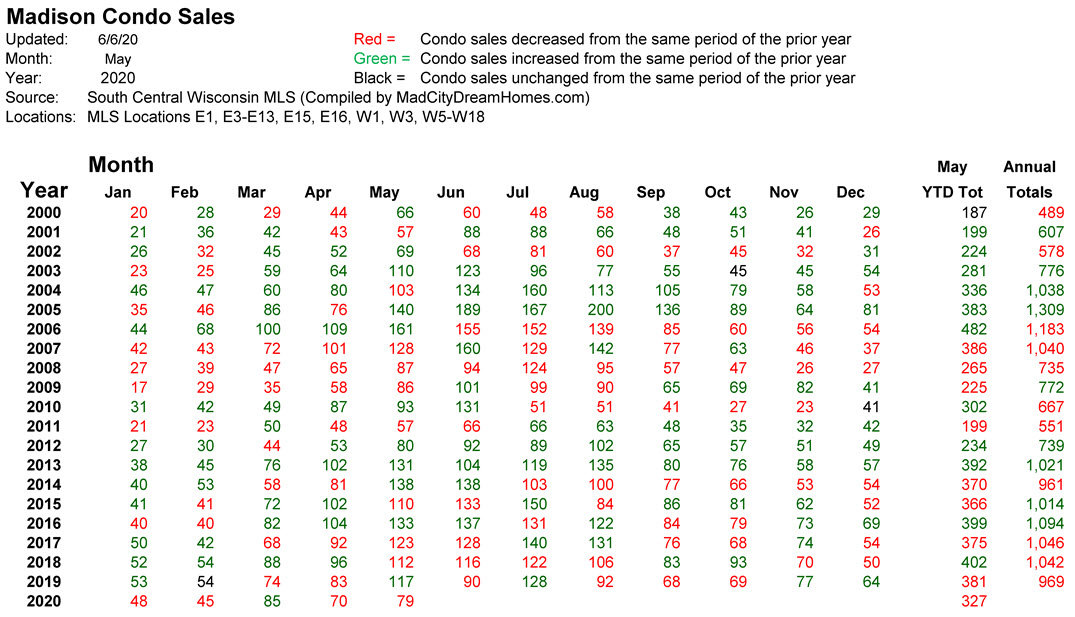
Madison Condo Sales: Jan, 2000 - May, 2020
This table shows the monthly, year-to-date and annual sold Madison condo listings for every time period dating back to January, 2000.
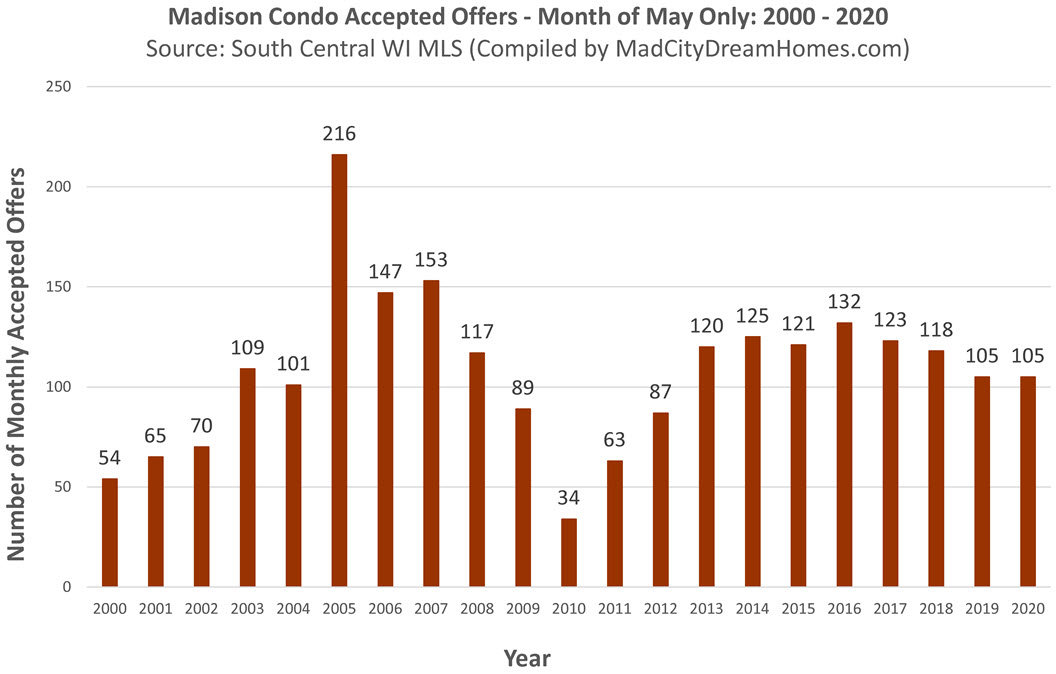
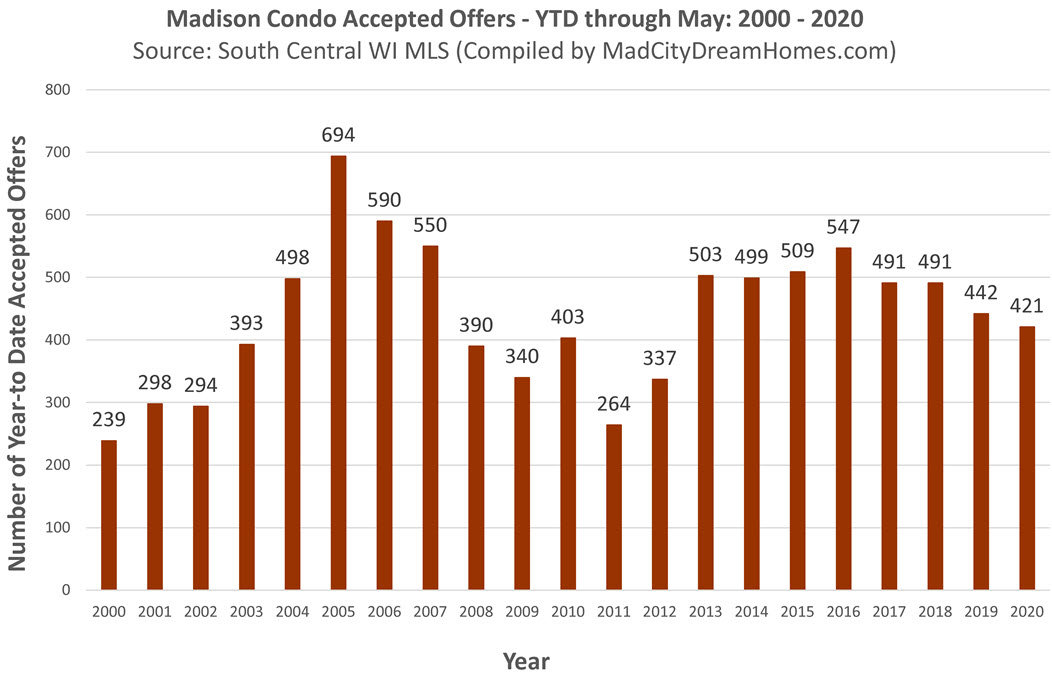
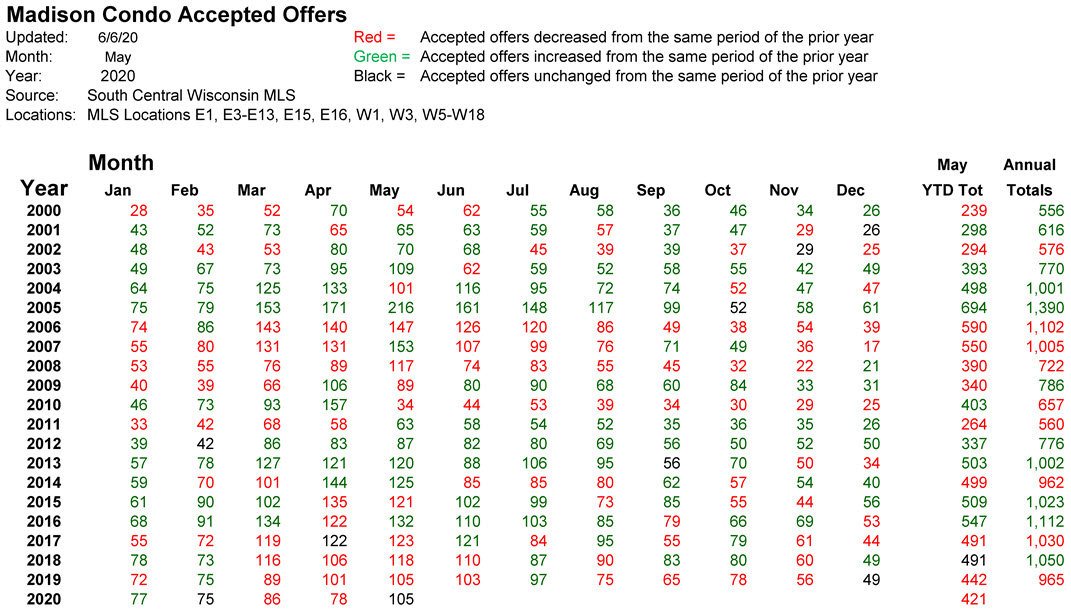
Madison Condo Accepted Offers - May, 2020
Accepted offers (or pending condo sales) provide an indication of the number of closings that can be expected in the months ahead. A total of 105 Madison condo listings received accepted offers in the month of May.
A total of 421 Madison condos received accepted offers year-to-date through the month of May.
A total of 962 Madison condo listings received accepted offers in 2019. Buyer activity would have been much stronger if more inventory was available for sale.
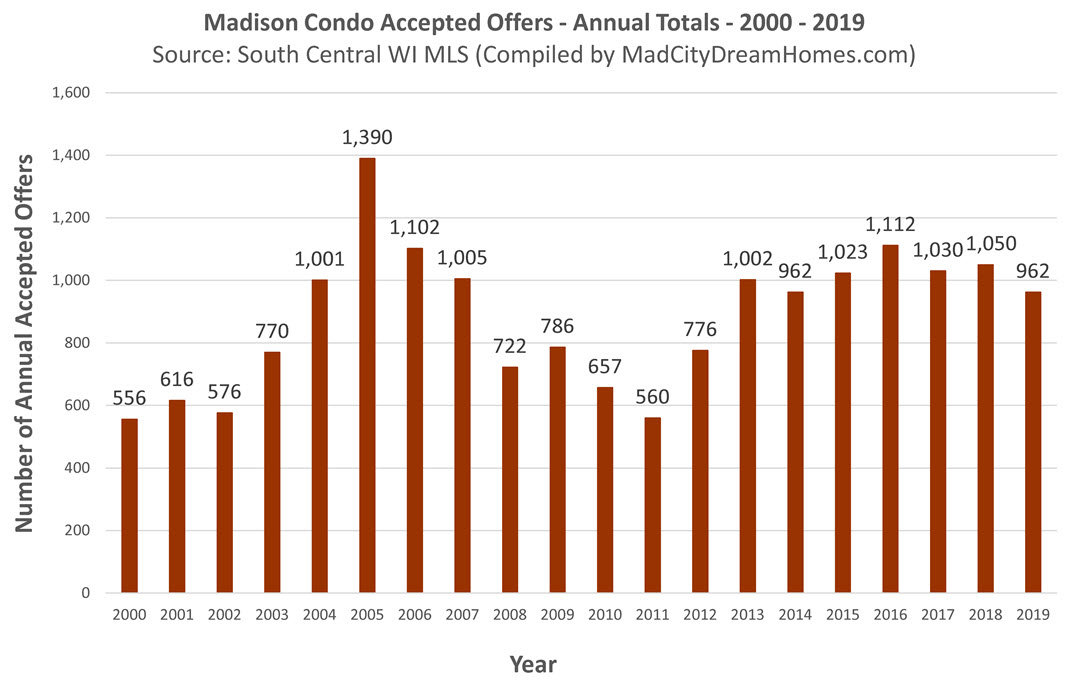
Madison Condo Accepted Offers: Jan, 2000 - May, 2020
The table below shows the monthly, year-to-date and annual Madison condo accepted offer totals for each time period dating back to January, 2000. Accepted offers have decreased due to low supply and a low influx of new construction condos.
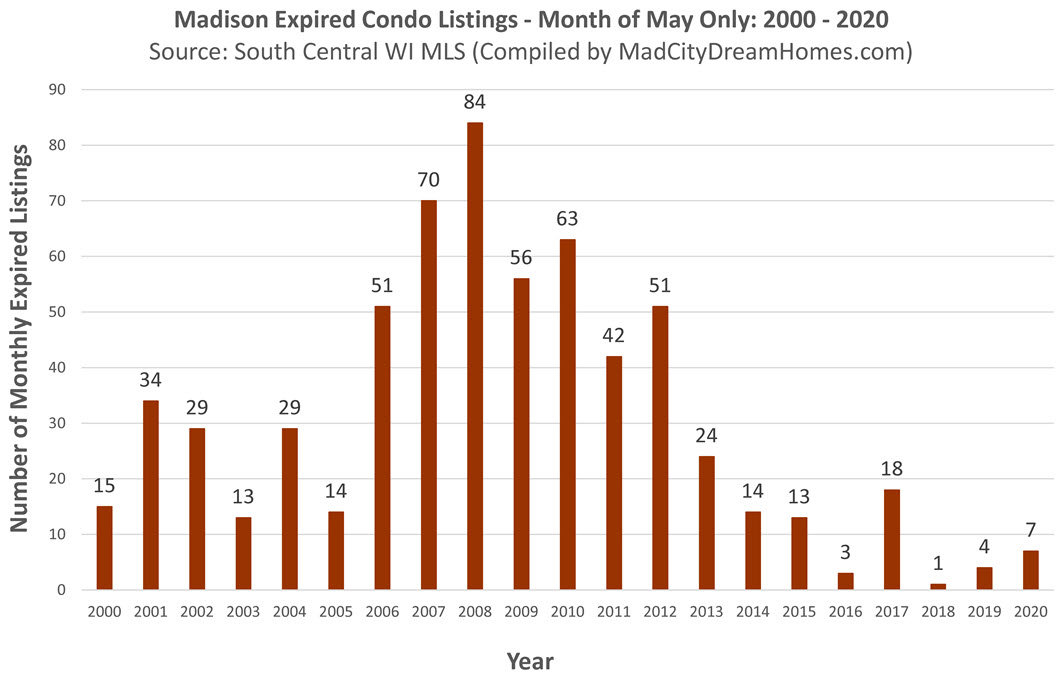
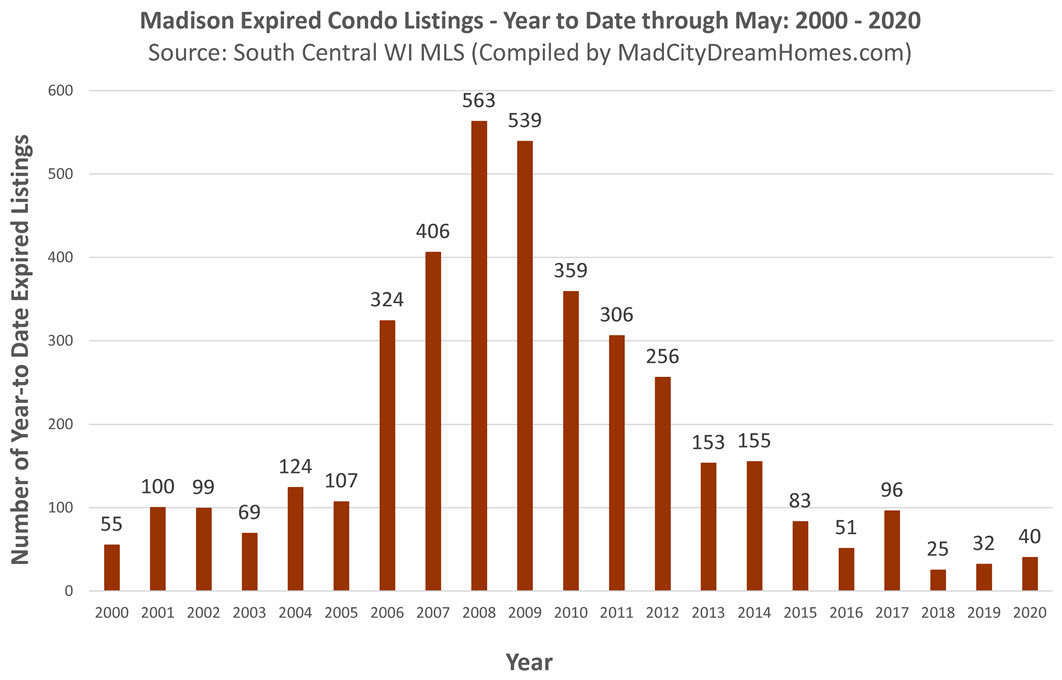
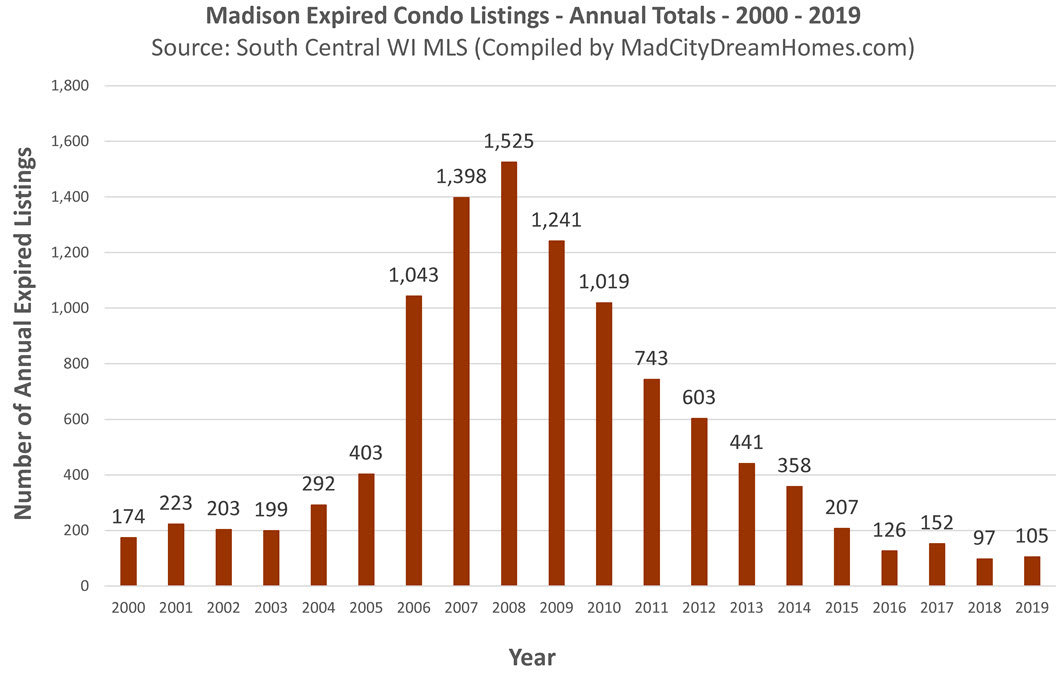
Madison Expired Condo Listings - May, 2020
A listing "expires" when it does not sell by the end date specified in the listing contract. A large number of expired listings indicates a strong buyers' market. A low number of expired listings indicates a strong sellers' market.
Expired listings are trending along historically low levels. Only 7 Madison condo listings expired in the month of May.
A total of 40 Madison condo listings expired year-to-date through the month of May, the third lowest on record.
A total of 105 Madison condo listings expired without selling in 2019. This represents the second lowest expired listing total on record.
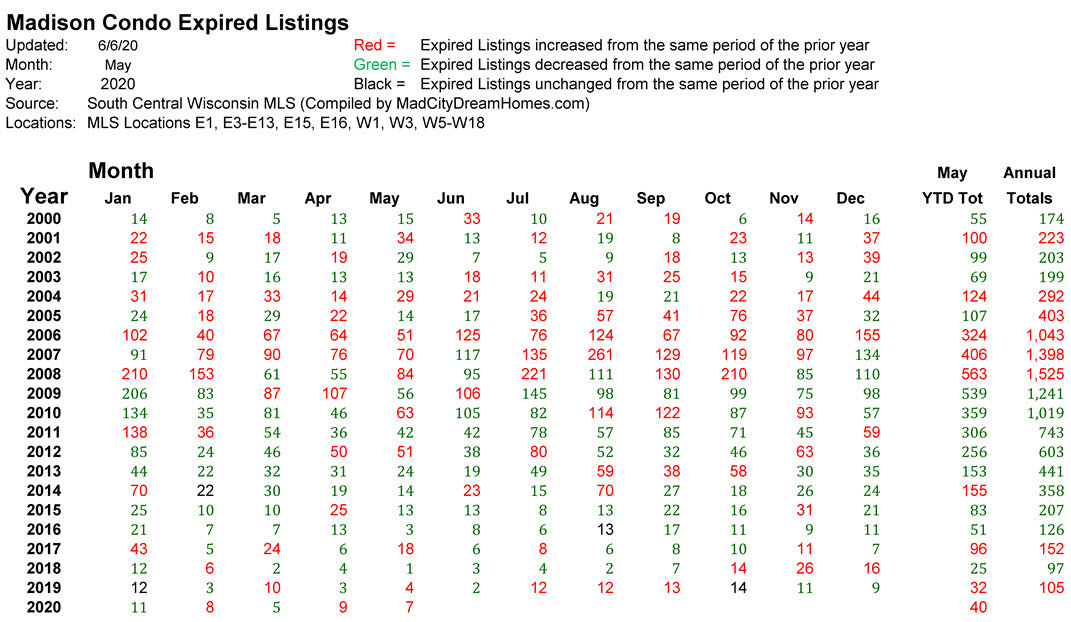
Madison Expired Condo Listings: Jan, 2000 - May, 2020
This table shows the monthly, year-to-date and annual expired condo totals for each time period dating back to January, 2000. The green data points show expired listings have been trending along a downward path since 2009.
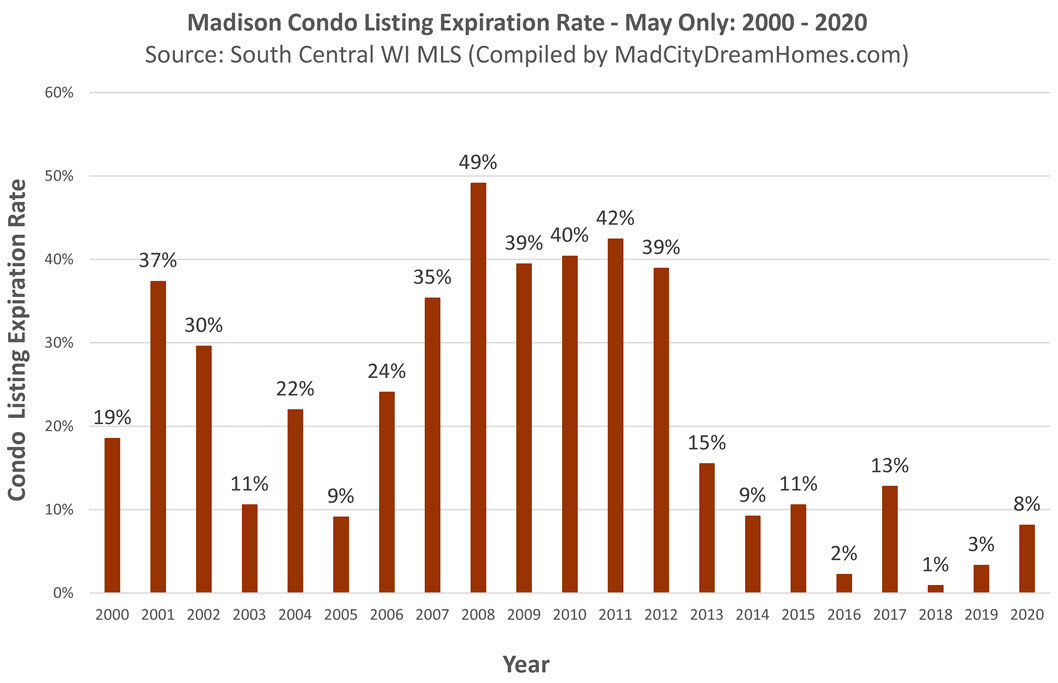
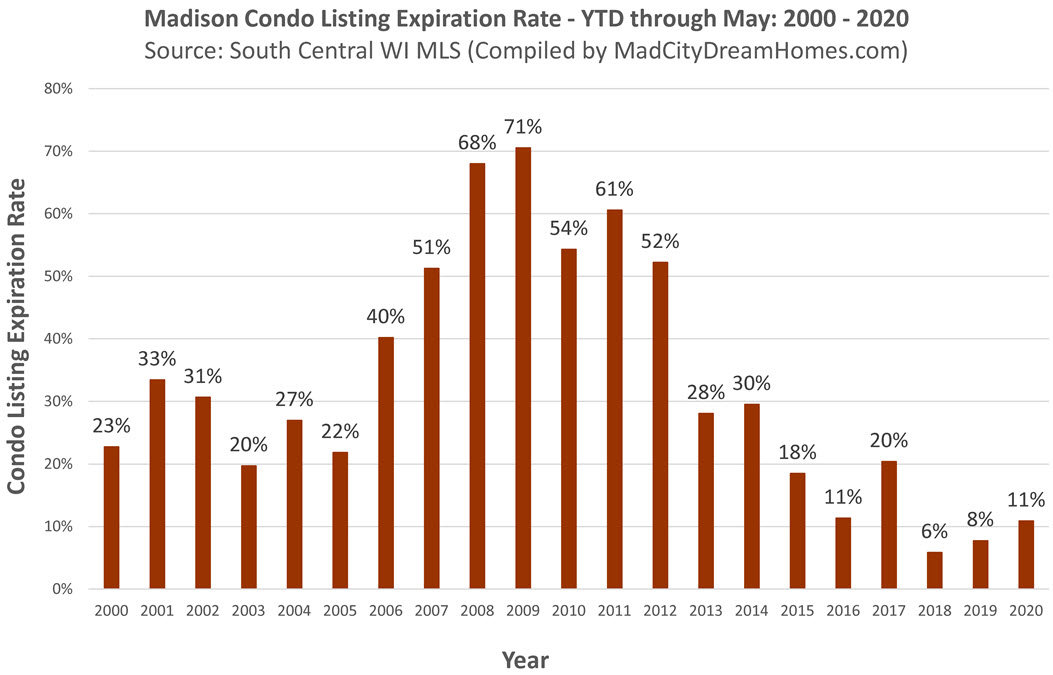
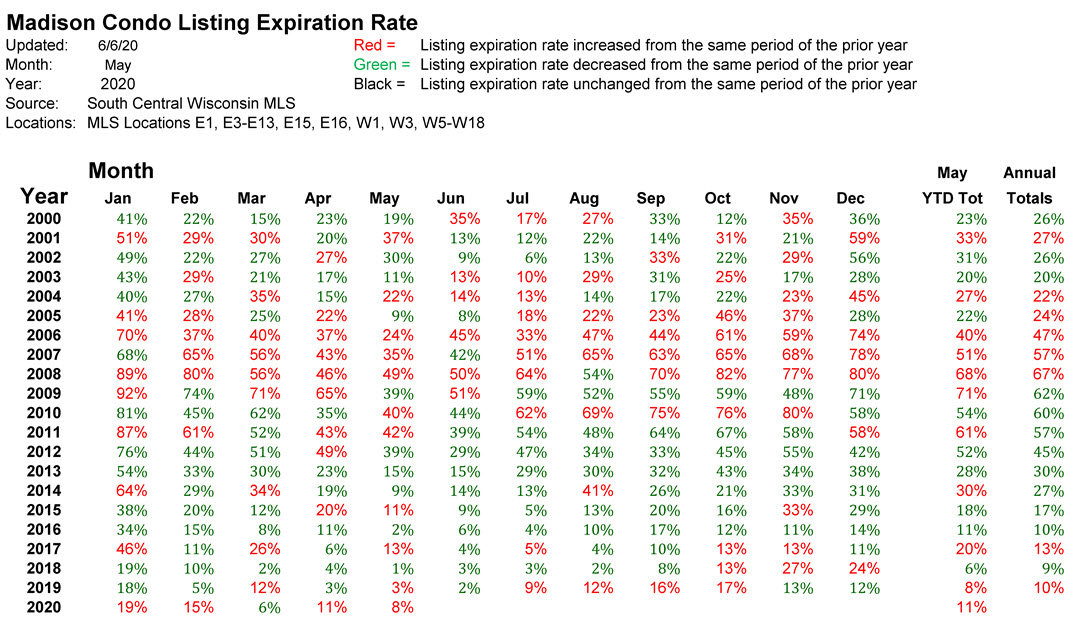
Madison Condo Listing Expiration Rate - May, 2020
The Madison condo listing expiration rate was only 8% in the month of May.
The year-to-date condo expiration rate through the month of March was 11% - the third lowest percentage on record.
The annual condo listing expiration rate in 2019 was 10% - the second lowest annual rate on record.
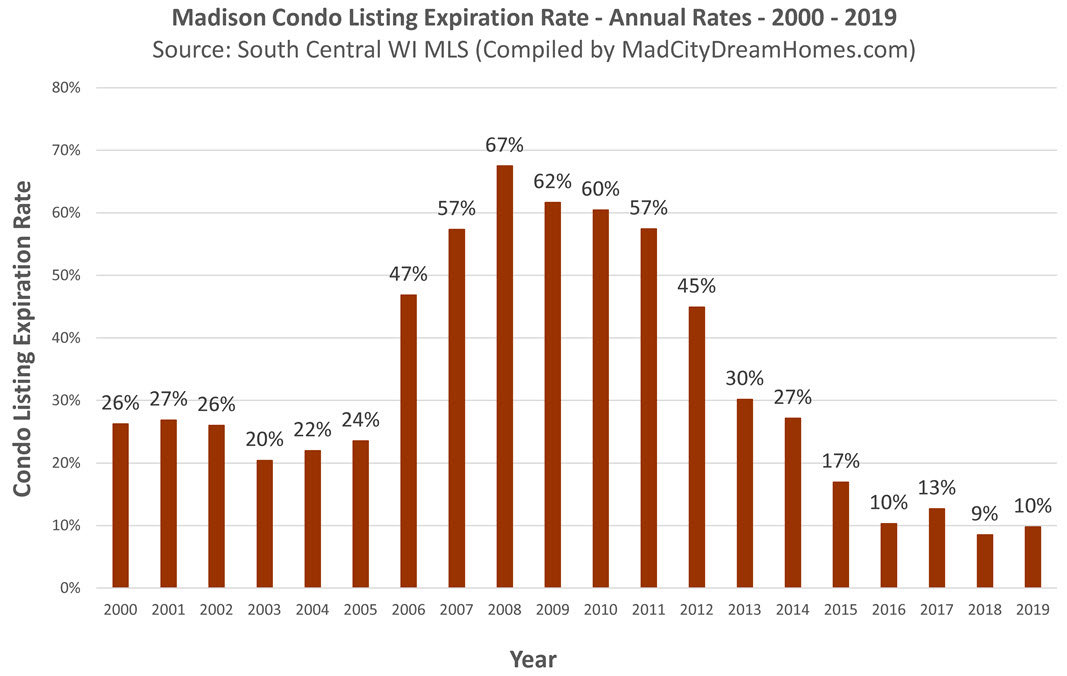
Madison Condo Listing Expiration Rate: Jan, 2000 - May, 2020
This table shows the monthly, year-to-date and annual condo listing expiration rate for every time period dating back to January, 2000.
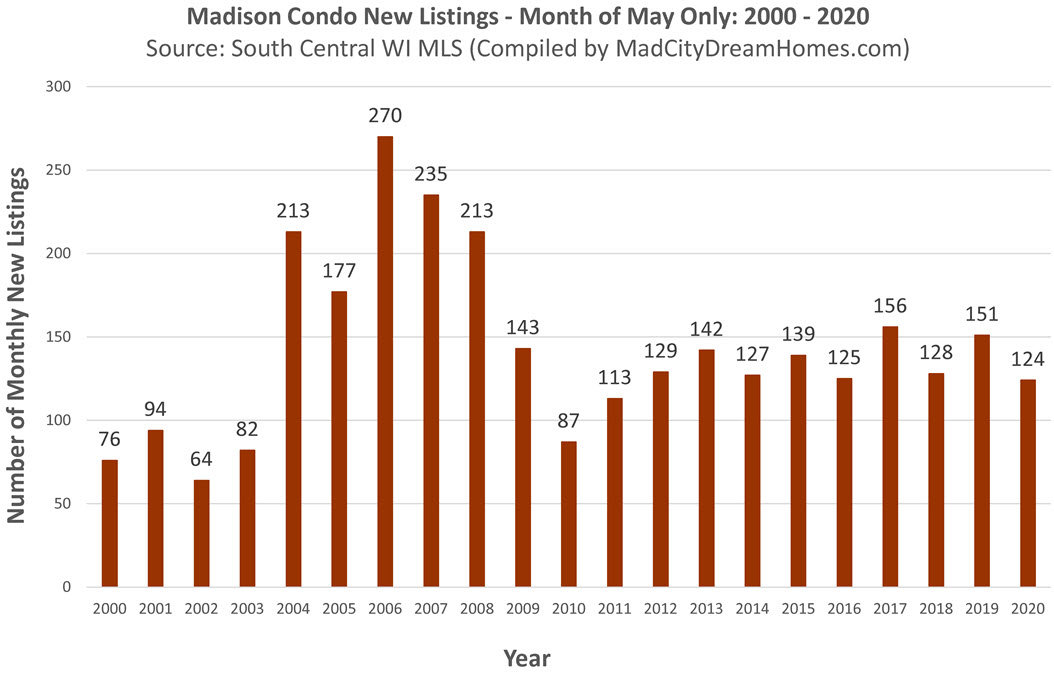
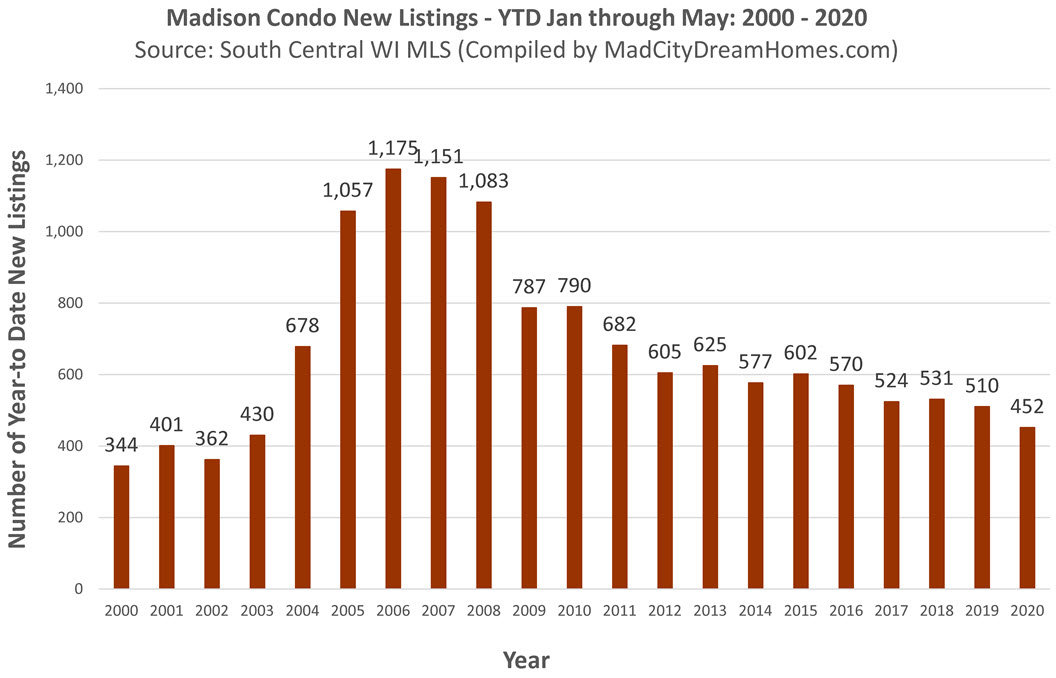
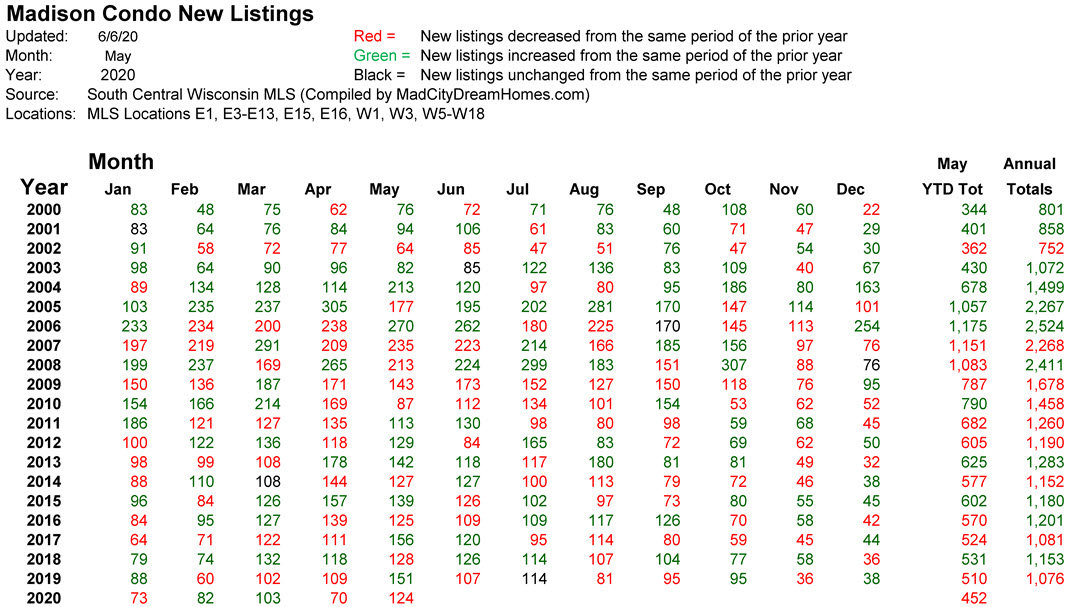
Madison Condo New Listings - May, 2020
The number of new listings entering the Madison condo market has been low by historical standards. A total of 124 condo listings entered the market in May. This was the lowest May listing total since 2011.
Year-to-date, a total of 452 new listings entered the Madison condo market through the month of May. which was the lowest year-to-date total since 2003.
A total of 1,071 new listings entered the Madison condo market in 2019. This was the lowest new listing total since 2002.
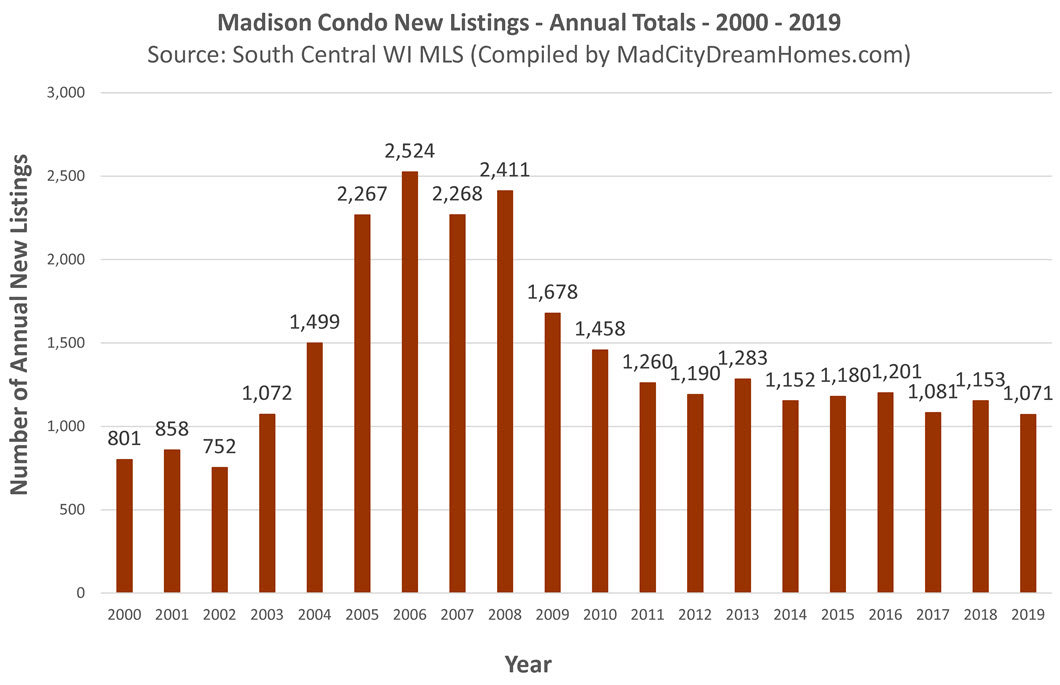
Madison Condo New Listings: January, 2000 - May, 2020
This table shows the number of new Madison condo listings by month dating back to January, 2000. A green data point indicates an increase in new listings. A red data point indicates a decrease.
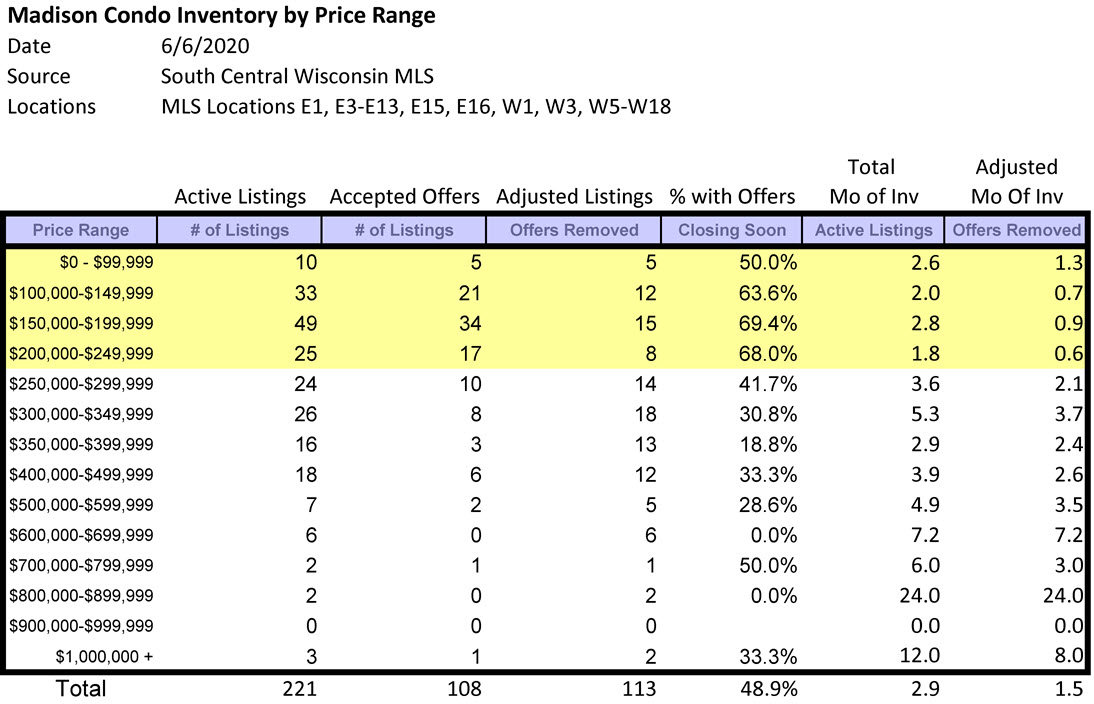
Madison WI Condo Inventory as of 6/6/2020
This table offers a good snapshot of our local condo market. The price ranges highlighted in yellow indicate segments of the market that are particularly favorable to sellers. All of the price ranges under $250,000 have very low levels of supply (refer to the column on the far right). Overall, 49% of all Madison condo listings have an accepted offer. Across all price ranges, there are only 1.5 months of inventory available in the Madison condo market as of June 6th, 2020.
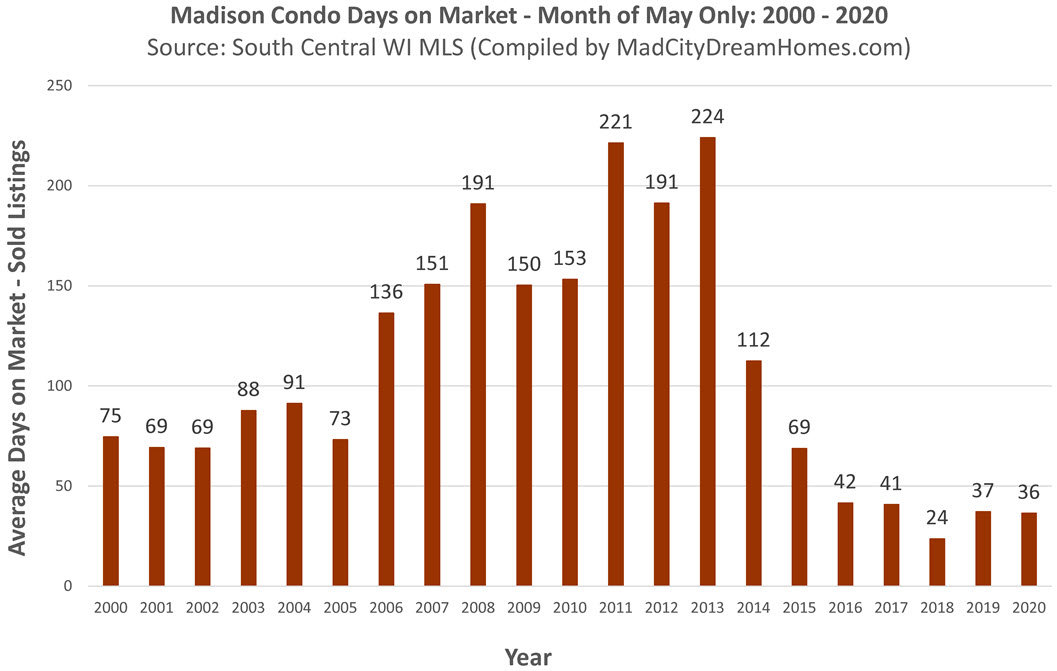
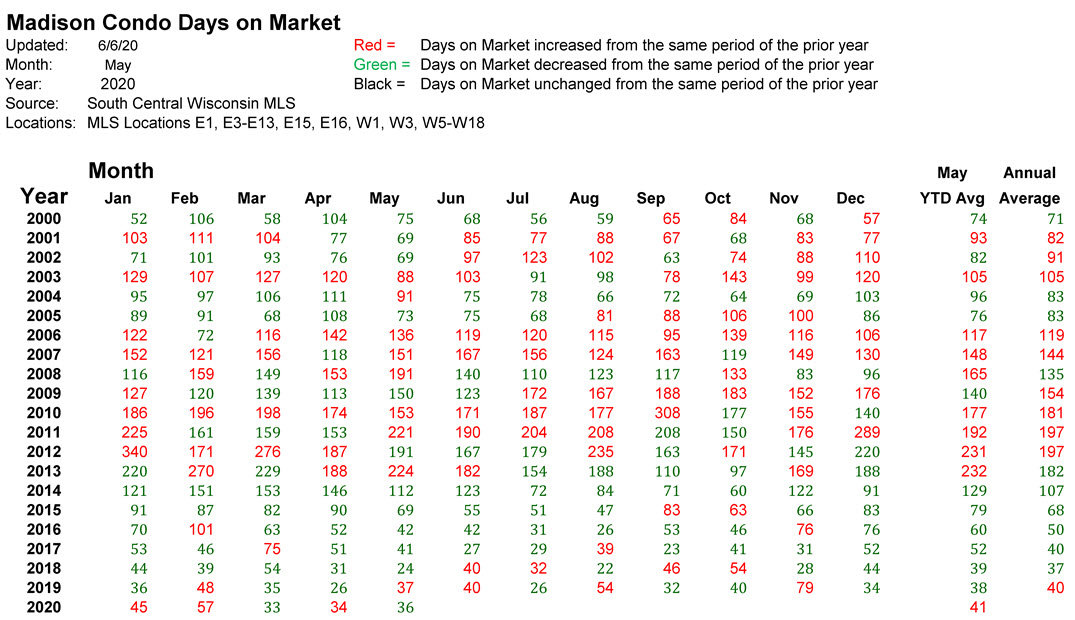
Madison WI Condos - Days on Market - May, 2020
How long does it take to sell a condo in Madison? The days on market statistic is represented by the number of days that pass from the listing start date to the listing accepted offer date. The days on market for Madison condos are now trending near historically low levels. The average for the month of May was 36 days. This was the second lowest average on record for the month.
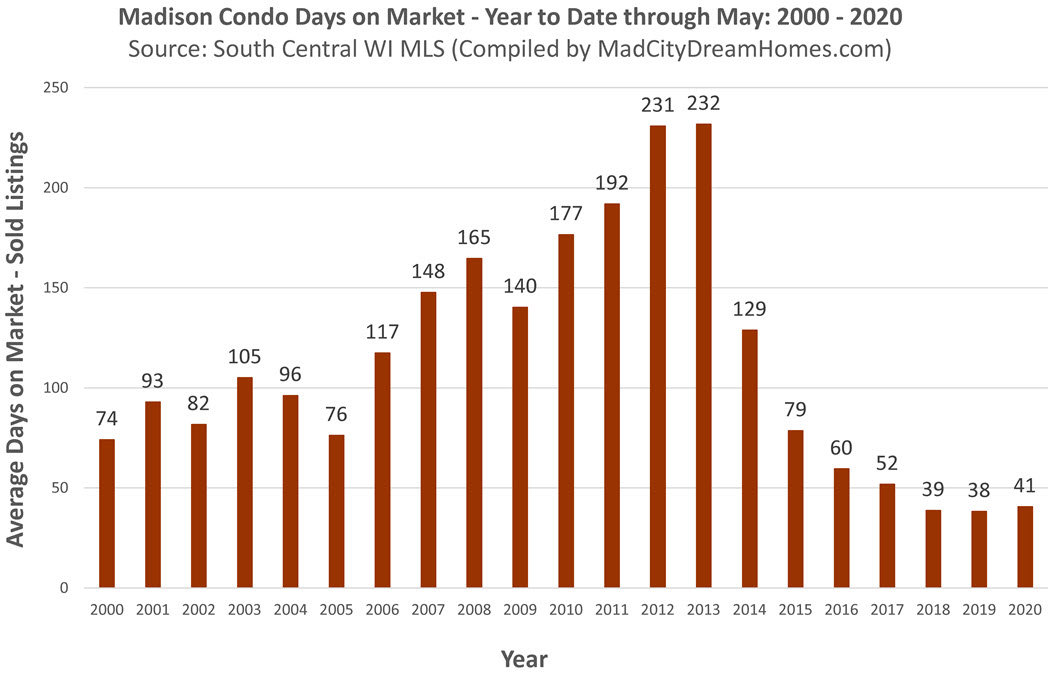
Year-to-date, the average Madison condo days on market through the month of May was only 41 days - the third lowest on record.
The average condo days on market for all of 2019 was only 40 days. This annual average was the second lowest on record.
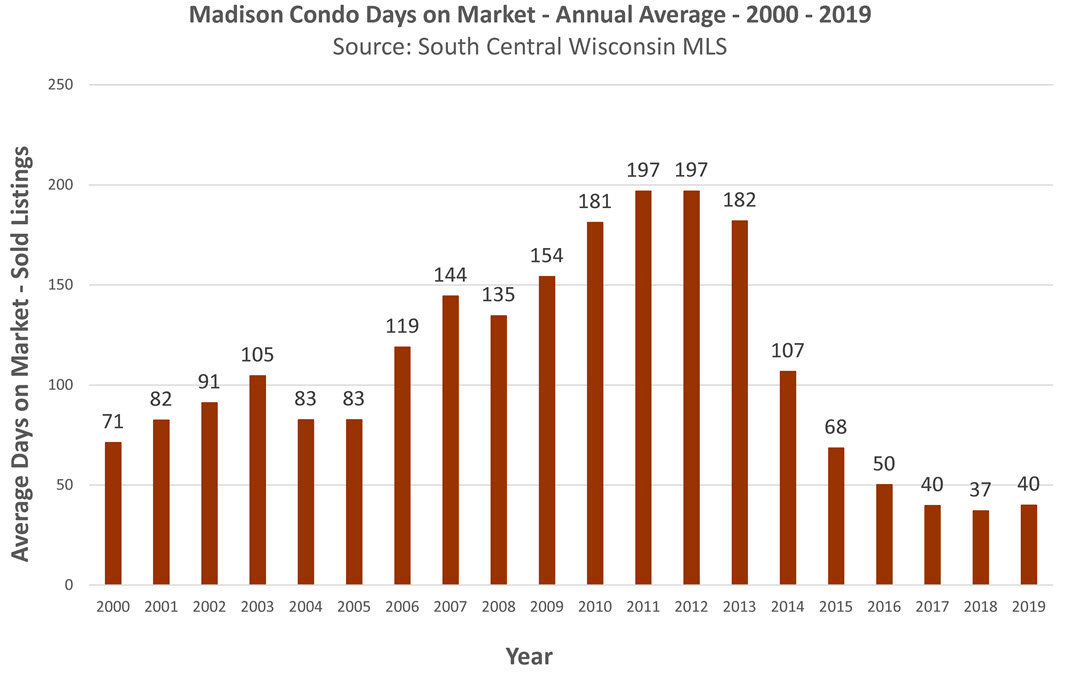
Madison Condo Days on Market: January, 2000 - May, 2020
This table shows the average condo days on market by month dating back to January, 2000. As the green data points show, the days on market for Madison condos have been trending much lower since 2014.
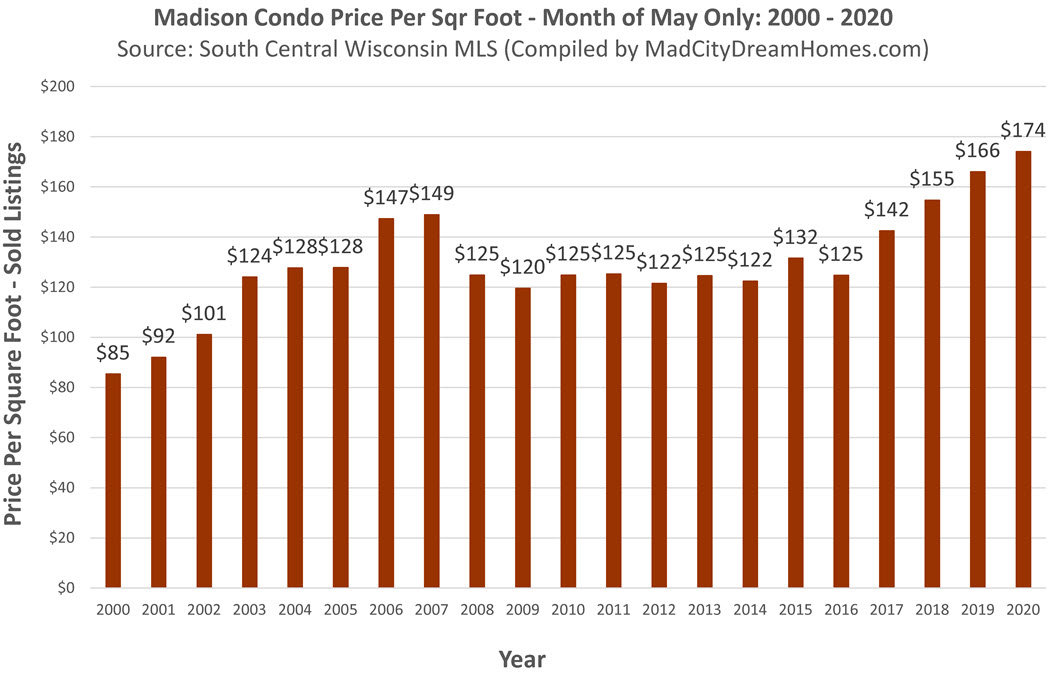
Madison WI Condo Prices - May, 2020
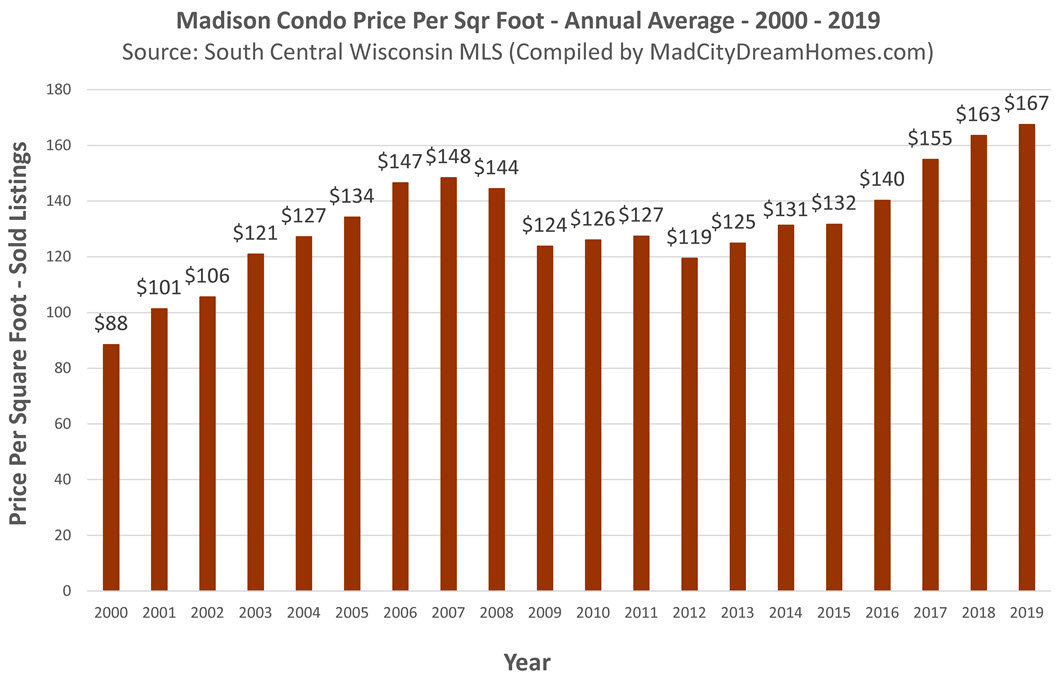
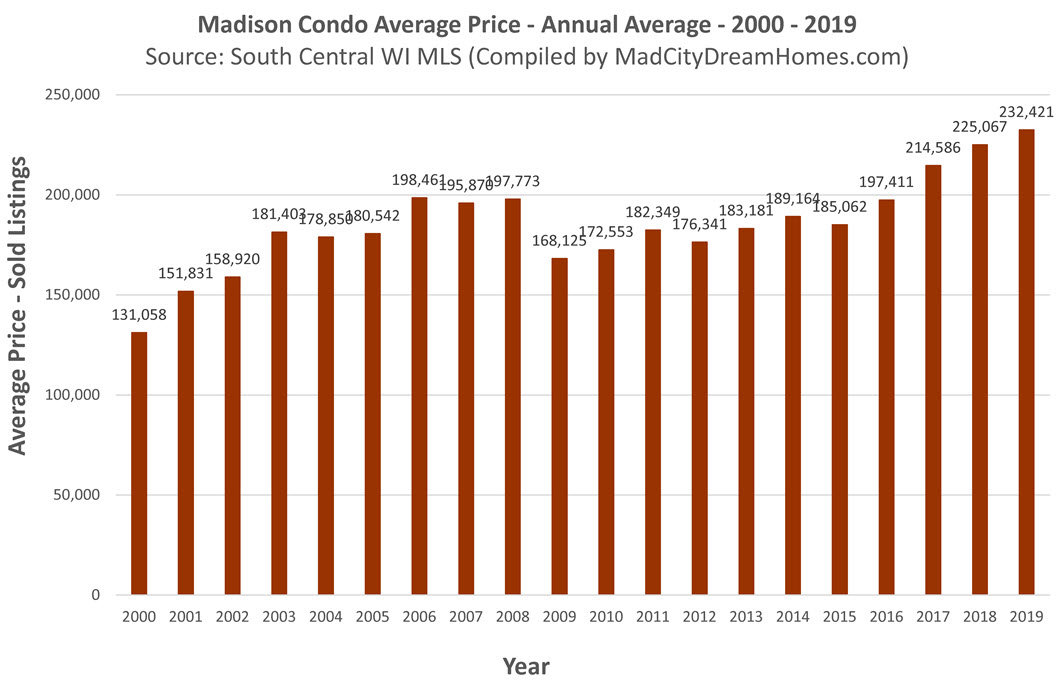
Our best measure of condo value is the price per square foot. In 2019, the average Madison condo price per square foot increased for the for the 7th straight year. Condo prices bottomed out in 2012 and began to rise again with increasing demand and falling supply. The graph below shows the average price per square foot for every year dating back to the year 2000. Madison condo prices in 2019 were the highest on record.
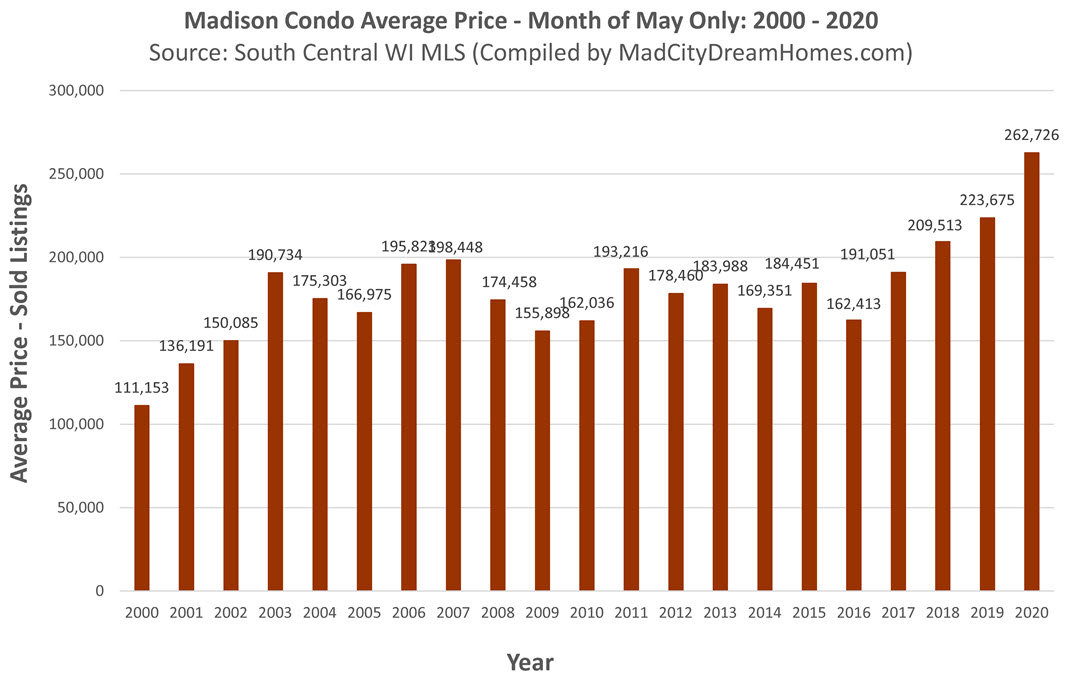
The average price per square foot in the month of May was $174 - which was the highest on record for the month and 5% higher than the previous record for the month of May.
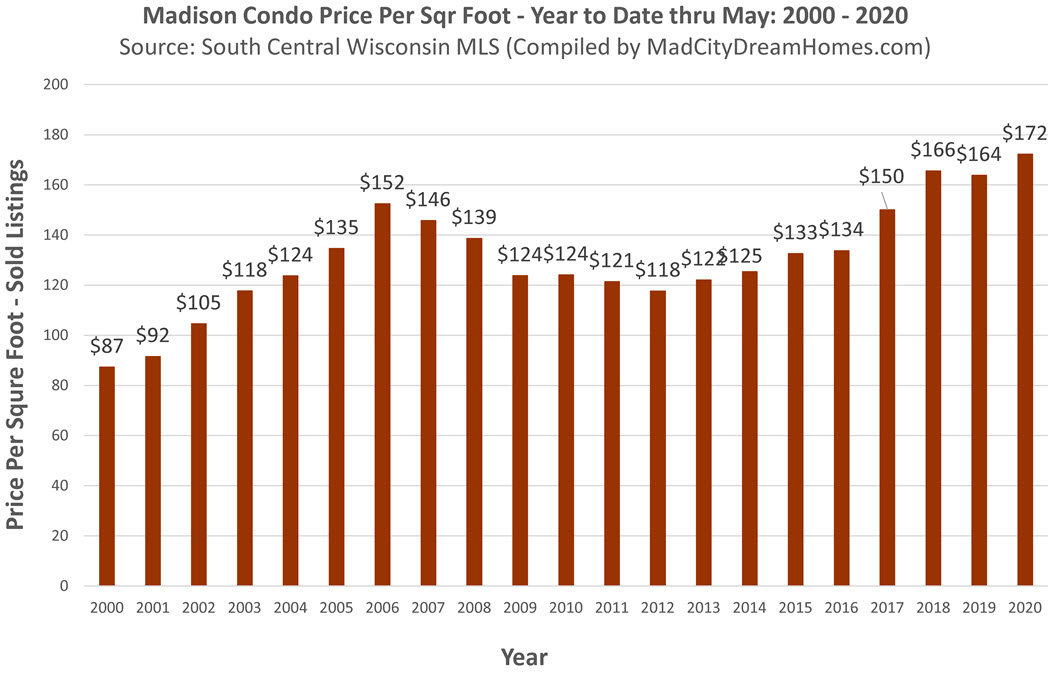
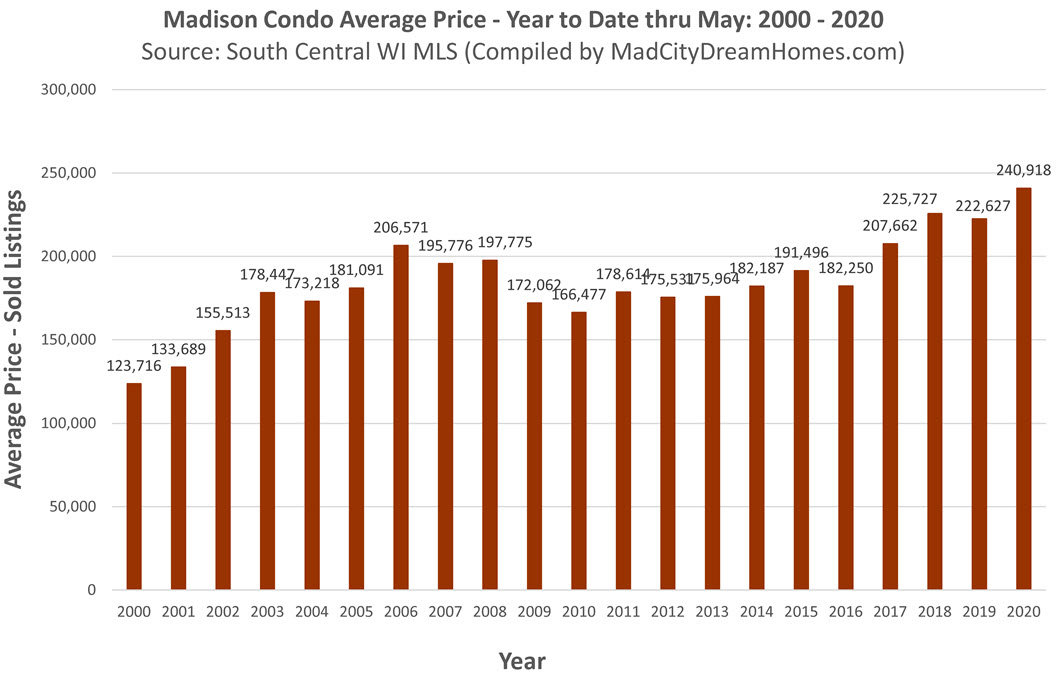
Year-to-date through May, the average price per square foot was $172 - a new high for the Madison condo market.
Historical Madison Condo Prices through Mary, 2020
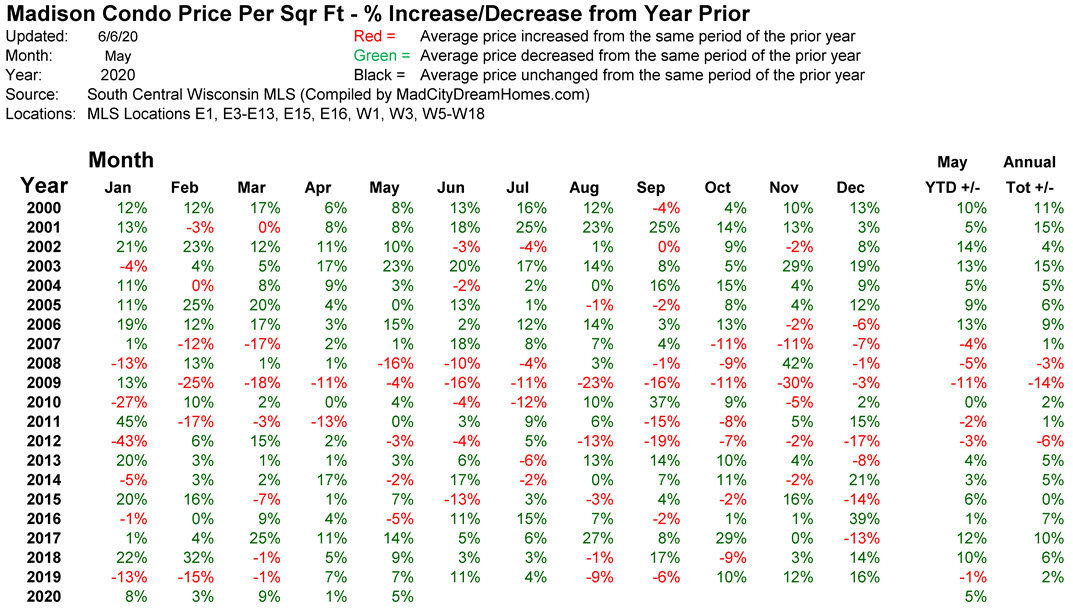
This table shows the percent change in the price per square foot for every time period dating back to January, 2000. The price per square foot increased by 5% year-over-over and 5% year-to-date in the month of May.
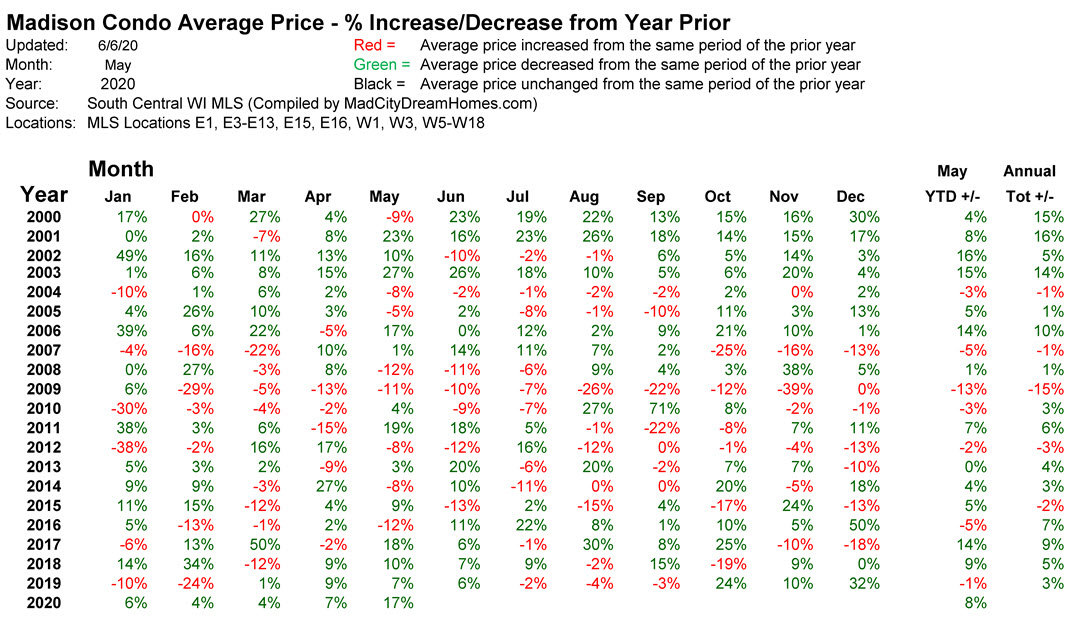
Madison Average Condo Price - May, 2020
The average Madison condo price in the month of May was $262,726 - an all-time high for the month. The average condo price can fluctuate greatly from month-to-month due to the relatively low number of sales compared to the single family home market. A few high-end or low-end condo sales can have a big impact on the average price in any given month. Therefore focus on the long-term trend over placing too much emphasis on any given month.
Year-to-date, the average Madison condo price was $240,918 through the month of May, also an all-time high.
The average condo price for all of 2019 was $232,421 - a record high for the Madison condo market.
Madison Condo Prices: January, 2000 - May, 2020
This table shows the percent increase/decrease in the average condo price for every month dating back to January, 2000. The average condo price increased by 17% in May and 8% year-to-date.
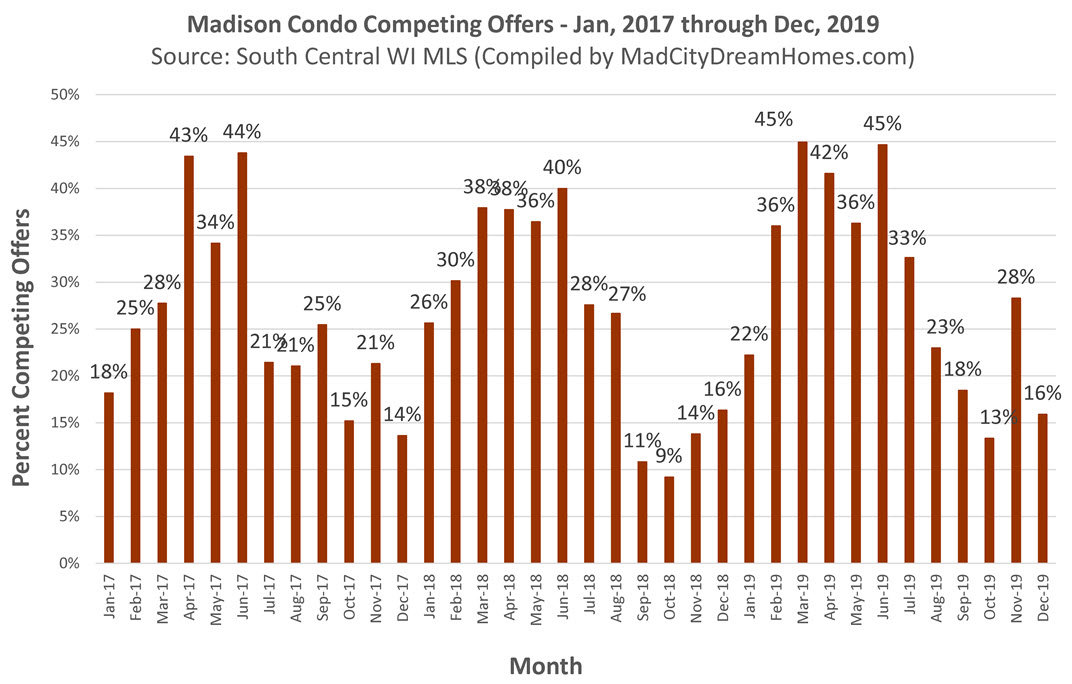
Madison Condos - % with Competing Offers - December, 2019
This statistic measures the percentage of condo listings that receive multiple offers. As the graph below shows, 16% of all accepted offers in December involved multiple offers. Multiple offers are most common in the Spring and early Summer and least common in the Fall and early Winter.
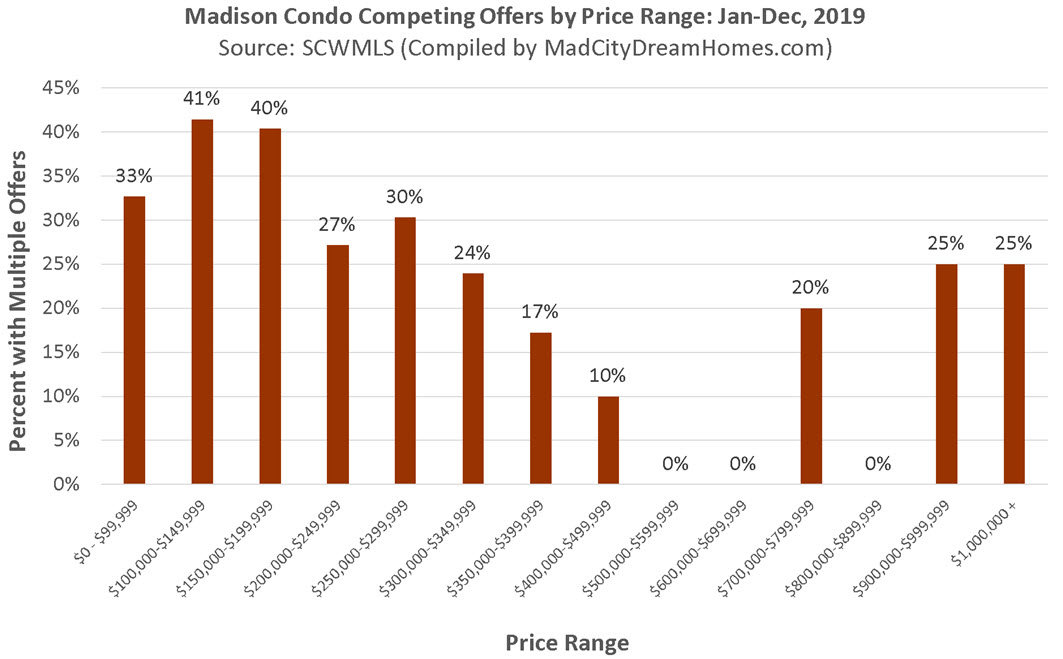
Competing Offers by Price Range: Jan-Dec, 2019
Which price ranges are the most competitive for condo buyers? The graph below shows the percentage of accepted offers that involve competition from multiple buyers. Generally speaking, condos in the most affordable price ranges are the most competitive. Overall, 32% of all accepted offers in 2019 have involved competition from multiple buyers. This is the highest percentage on record.
About the Author
Dan Miller has been studying and reporting on the Madison condo market since 2007. Please feel free to contact Dan with any questions you have about your local condo market.