
Madison, WI Real Estate Trends:
May, 2020
This report summarizes the latest market trends for single family homes in Madison, Wisconsin. All data comes from the South Central Wisconsin MLS. Unless otherwise noted, all statistics are current through the month of May, 2020.
The Madison real estate market was very active in the month of March, but we will see the market changing throughout the remainder of the year due to the coronavirus pandemic. We encourage you to stay in touch with our market reports and our blog as we share all of the latest trends and our observations. Below is a snapshot from our May, 2020 report.
View our monthly Madison condo update here.
Madison Real Estate Market Summary: May, 2020
- Madison home sales decreased in May but were higher year-to-date.
- Accepted offers decreased in May because fewer homes are being listed for sale in this year's market.
- Expired listings remain historically low through the month of May.
- The Madison single family listing expiration rate was very low by historical standards in the month of May.
- New listings continued to trend along low levels through the month of May. New listings decreased 39% during the month and 19% year-to-date.
- As of June 3rd, 2020, over 50% of all single family listings were under contract with an accepted offer. Less than 1 month of supply is available for sale in the Madison single family home market. Even during the pandemic, many listings in the Madison area are receiving multiple offers due to the limited supply of homes in the area, especially properties priced under $350,000.
- The average days on market through the month of May was the lowest on record.
- Madison home prices are up significantly through the month of May. The price per square foot is up 6% from last year and currently at a record high level. The average price is also at a new high and up 4% from last year.
- Competing offers in 2019 reached a record high in Madison. Overall, 33% of all single family home listings received multiple offers, compared to 32% in 2018.
Our full reports follow:
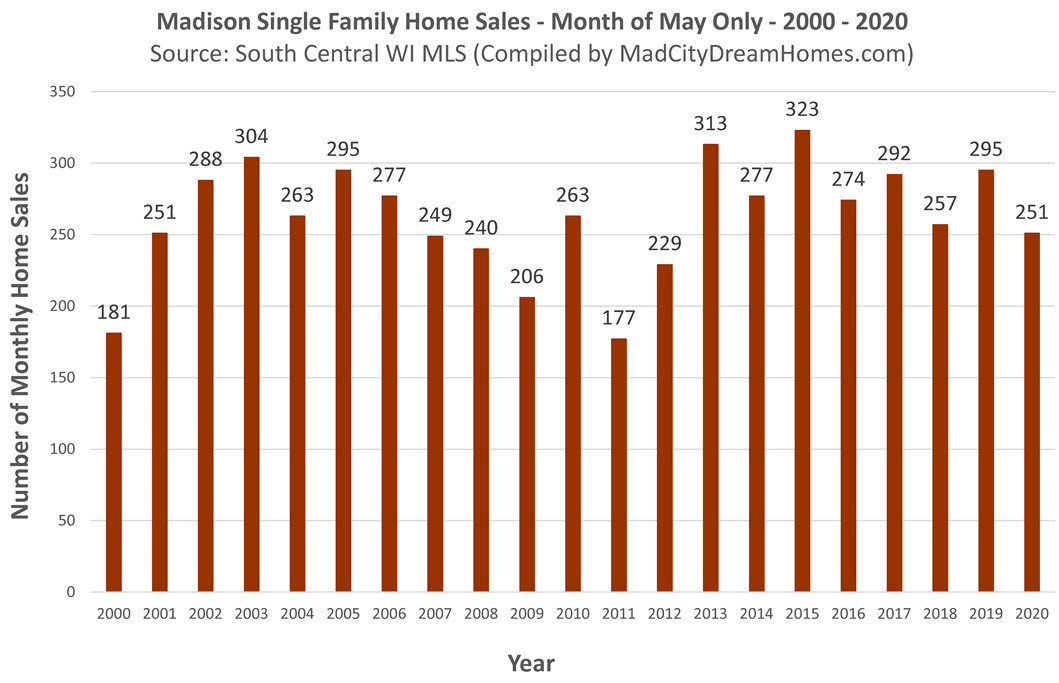
Madison WI Home Sales - May, 2020
Madison home sales decreased by 15% in the month of May. We expect lower supply will limit home sales for the rest of 2020.
Year-to-date, home sales are up from the same time period last year - because sales increased during the first 4 months of 2020.
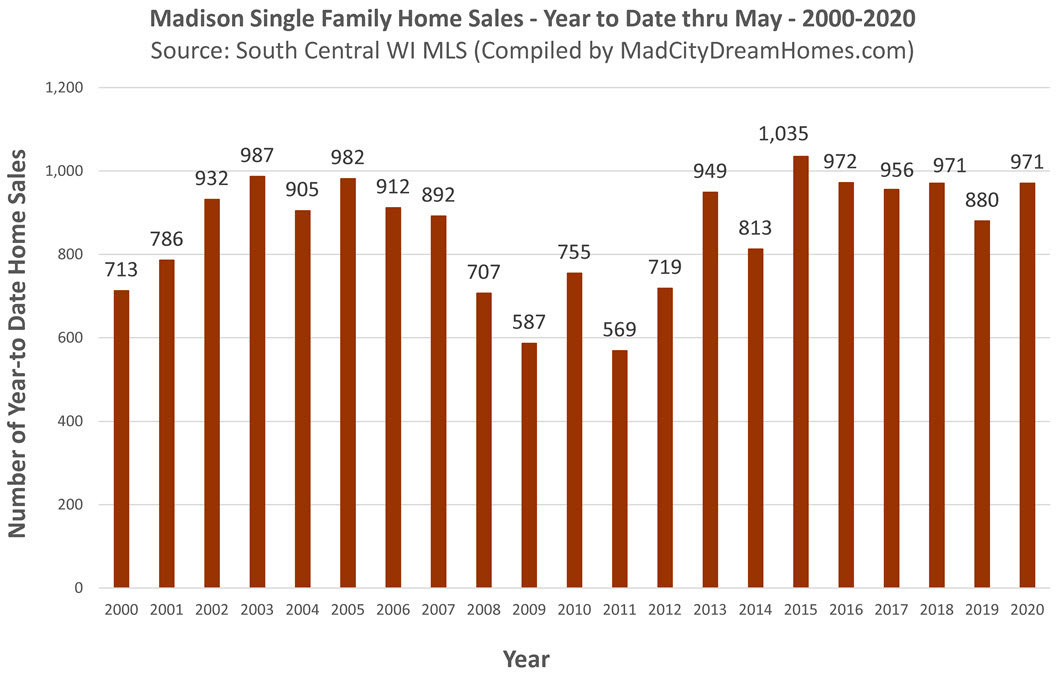
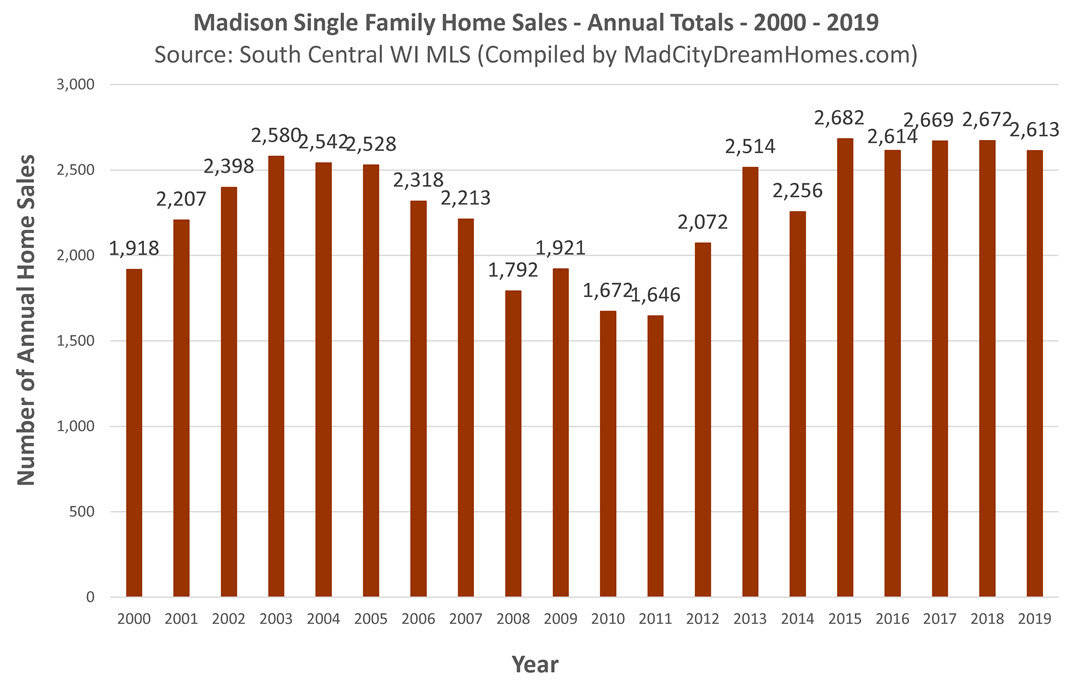
On an annual basis, a total of 2,613 Madison single family listings sold in 2019, just under the 2,672 listings sold in 2018.
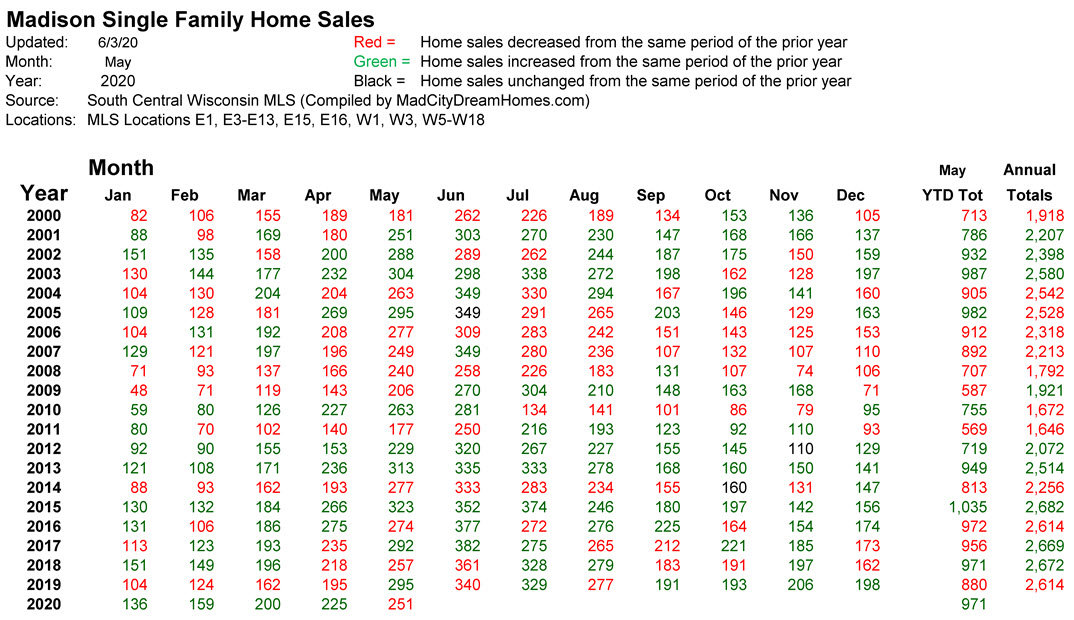
Madison Home Sales: January, 2000 - May, 2020
This table shows the monthly, year-to-date and annual Madison home sale totals for every time period dating back to January, 2000. Note: Green indicates a sales increase from the same time period of the previous year. Red indicates a sales decrease.
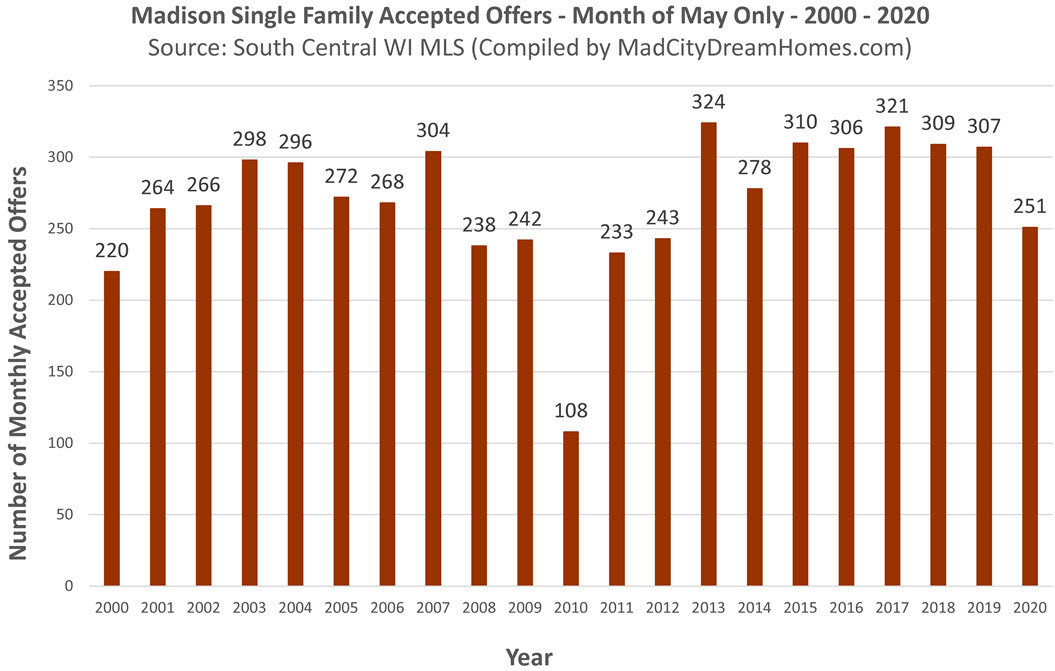
Madison Single Family Accepted Offers - May, 2020
Accepted offers (i.e. "pending home sales") provide a forward-looking view of the market. When accepted offers rise, that's an indication that closings (i.e. home sales) will increase in the months ahead. A total of 251 Madison single family home listings received accepted offers in the month of May, which was down 18% from May of 2019. Accepted offers are lower because fewer home owners are choosing to sell during the COVID-19 market.
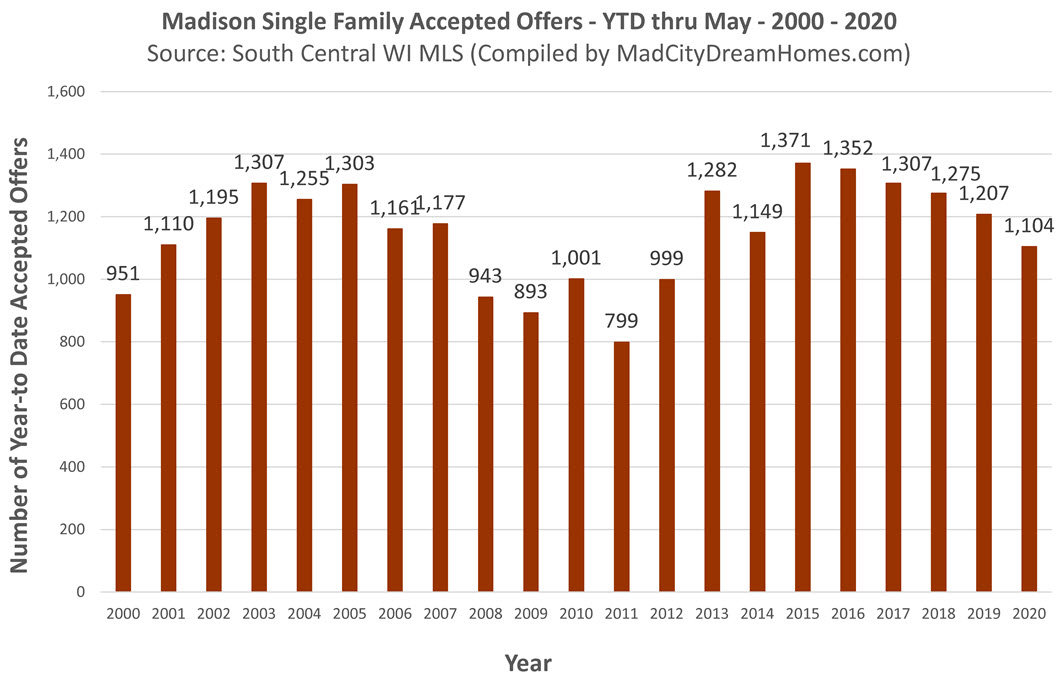
A total of 1,104 Madison single family listings received accepted offers year-to-date through the month of May, which was down 9% from the year before. Lower listing activity is limiting the number accepted offers in this year's market.
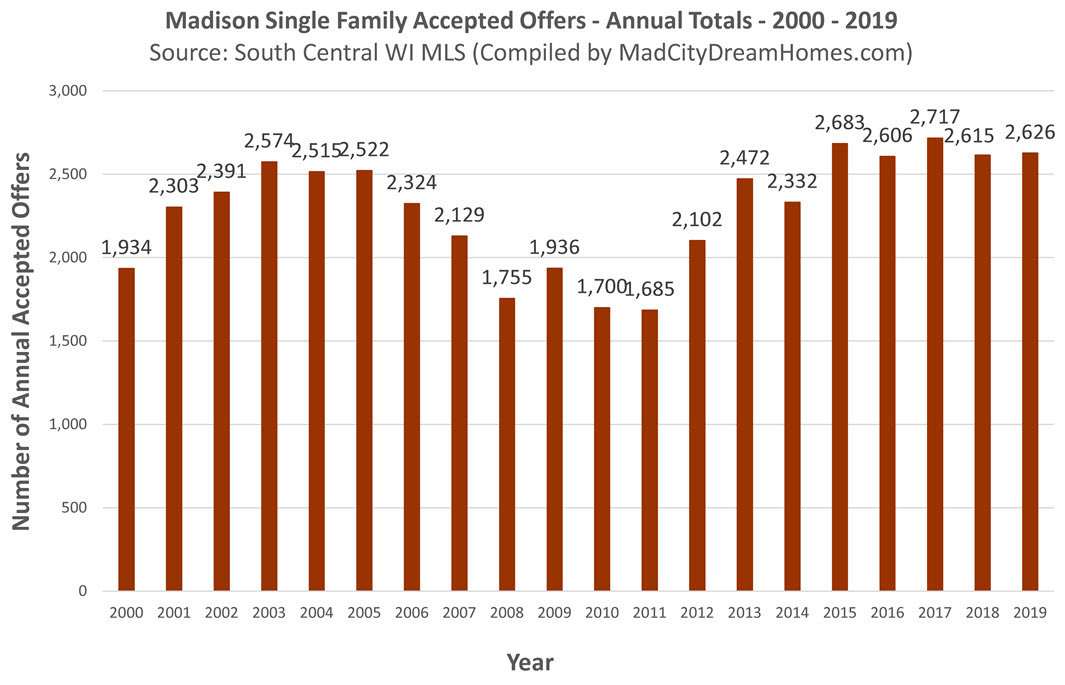
A total of 2,626 single family home listings received accepted offers in 2019. This was a strong year for the Madison single family home market - despite the very low levels of inventory.
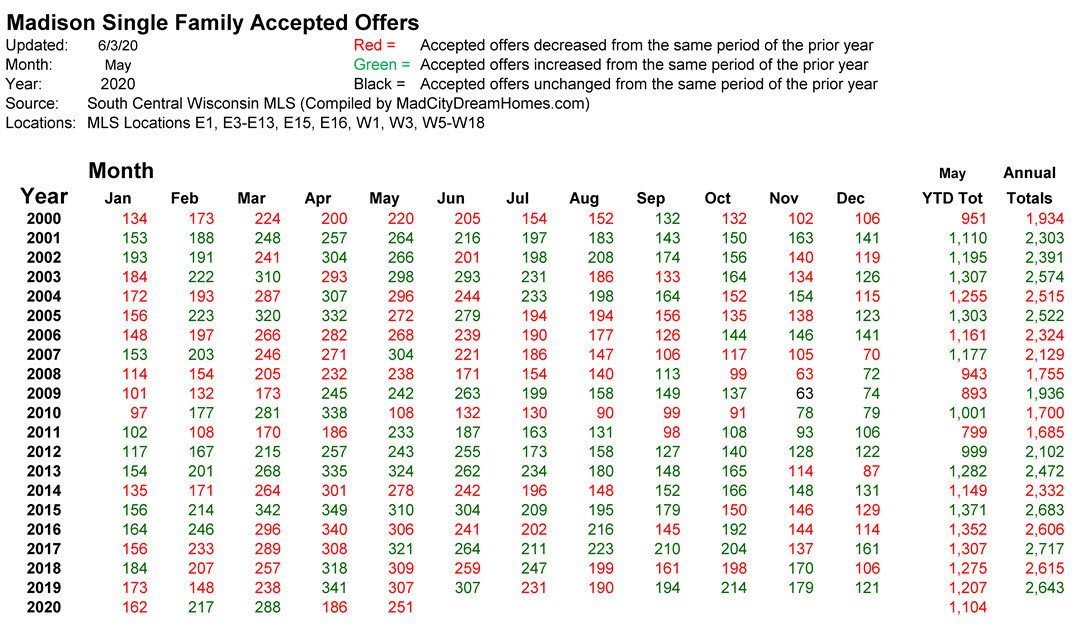
Madison Single Family Accepted Offers: Jan, 2000 - May, 2020
This table shows the monthly, year-to-date and annual Madison single family accepted offer totals for each time period dating back to January, 2000.
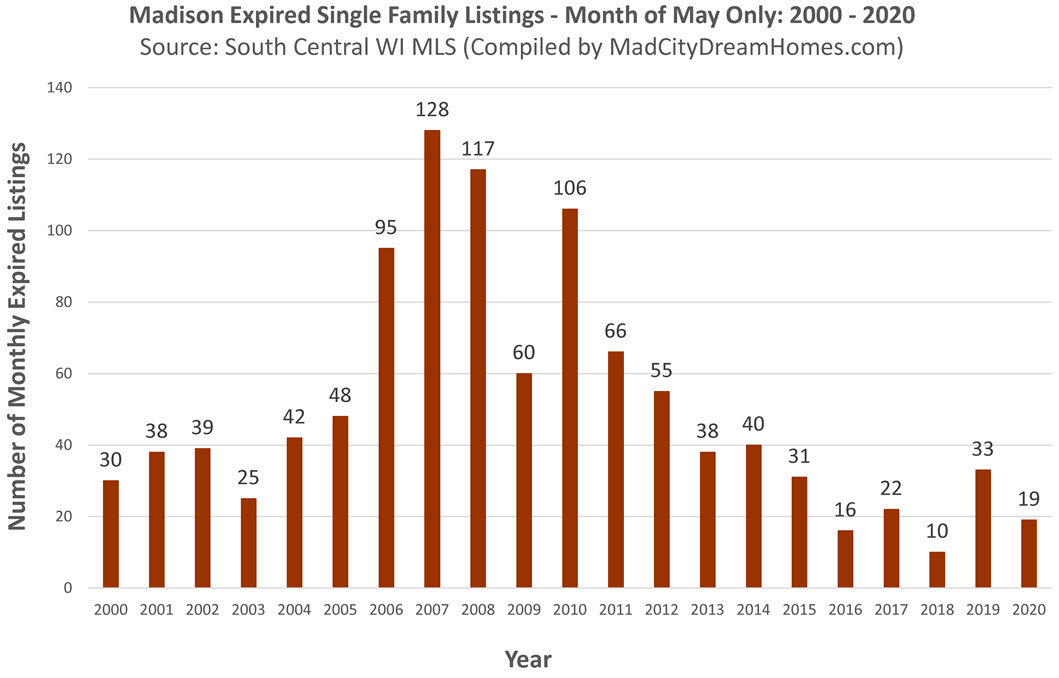
Madison Expired Single Family Listings - May, 2020
A total of 19 Madison single family home listings expired in the month of May, which was the third lowest total on record for the month.
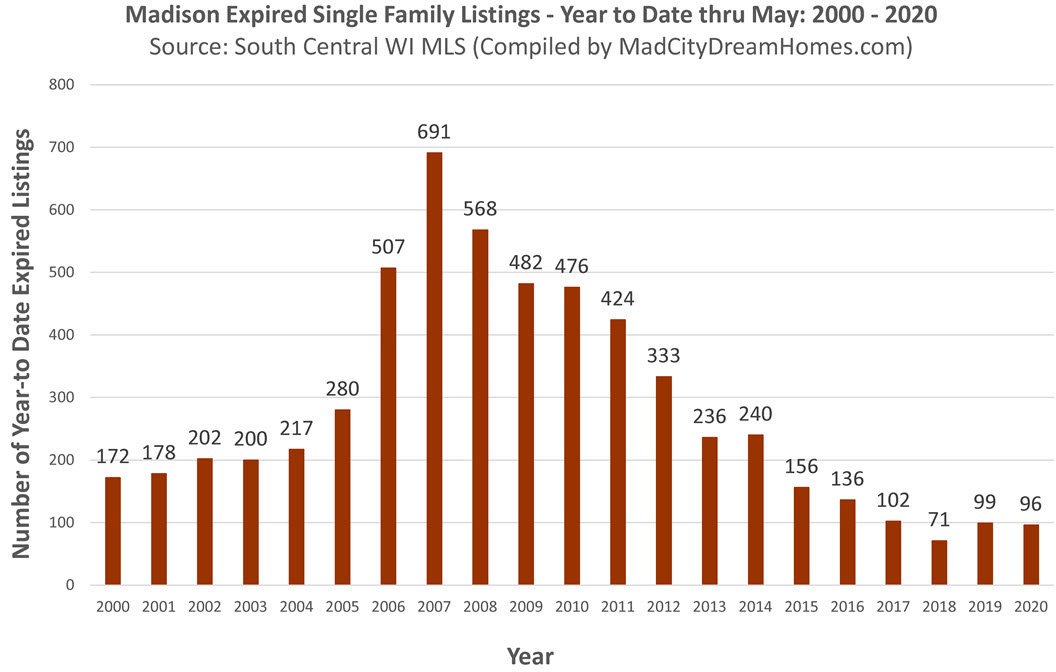
A total of 96 Madison single family home listings expired year-to-date through the month of March, which was very low from an historical perspective.
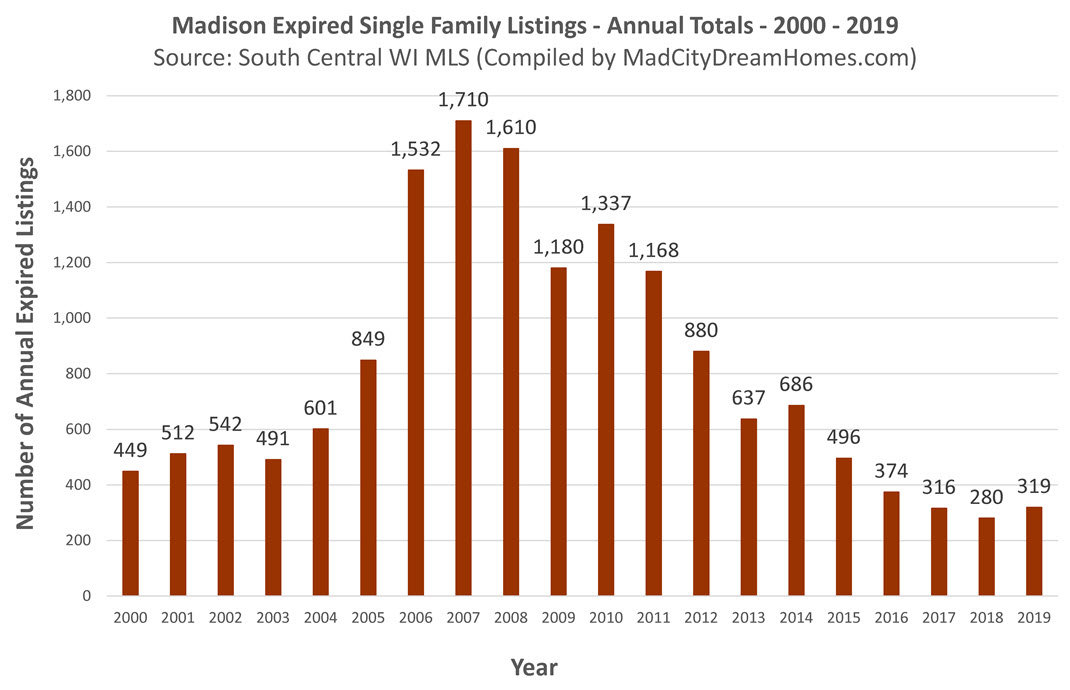
A total of 319 Madison single family home listings expired in 2019, which was the third lowest expired listing total going back to the year 2000.
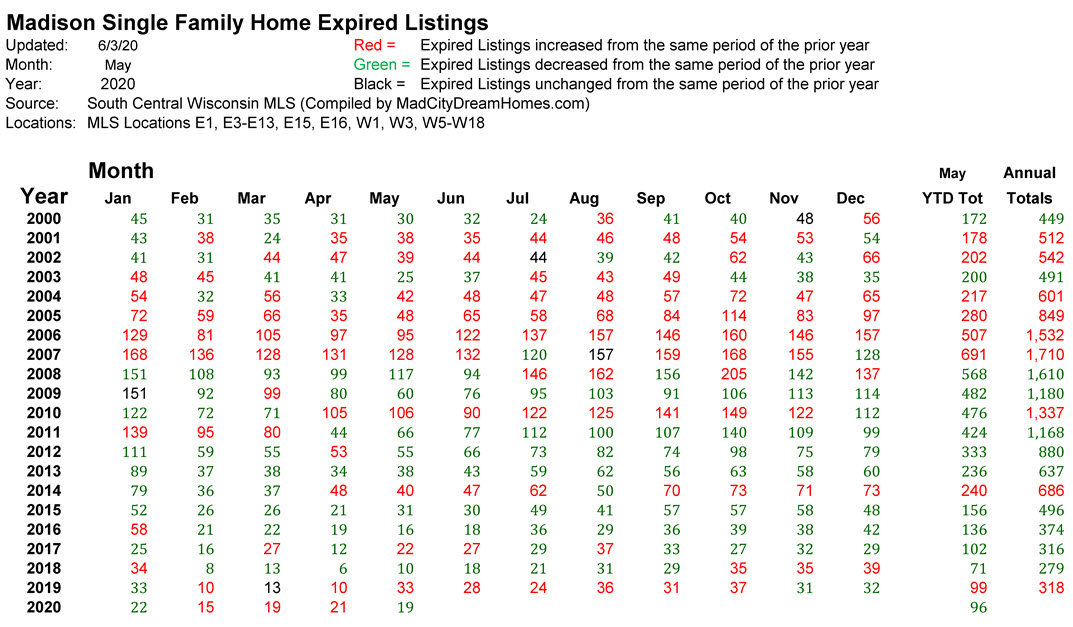
Madison Expired Single Family Listings: Jan, 2000 - May, 2020
This table shows the monthly, year-to-date and annual Madison expired listing totals for each time period dating back to January, 2000.
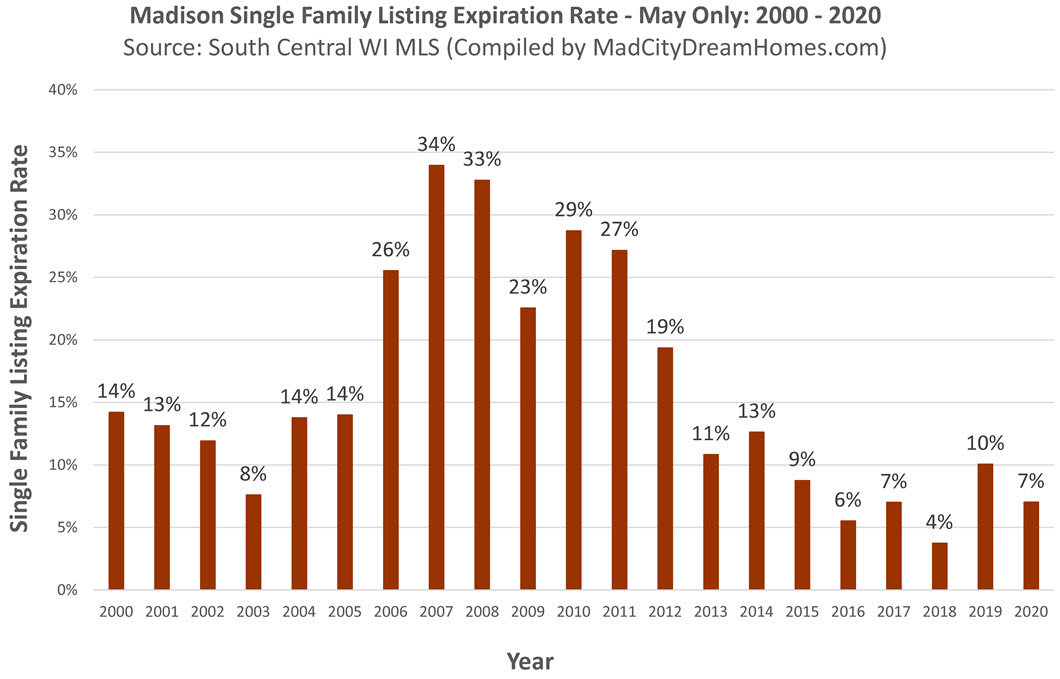
Madison Single Family Expiration Rate - May, 2020
A listing can either "sell" or "expire". The listing expiration rate represents the percentage of listings that expire. Low expiration rates are seen in strong sellers' markets. High expiration rates are seen in strong buyers' markets.
The Madison single family listing expiration rate in the month of May was 7%. As the graph below shows, this was low when compared to most other years dating back to the year 2000.
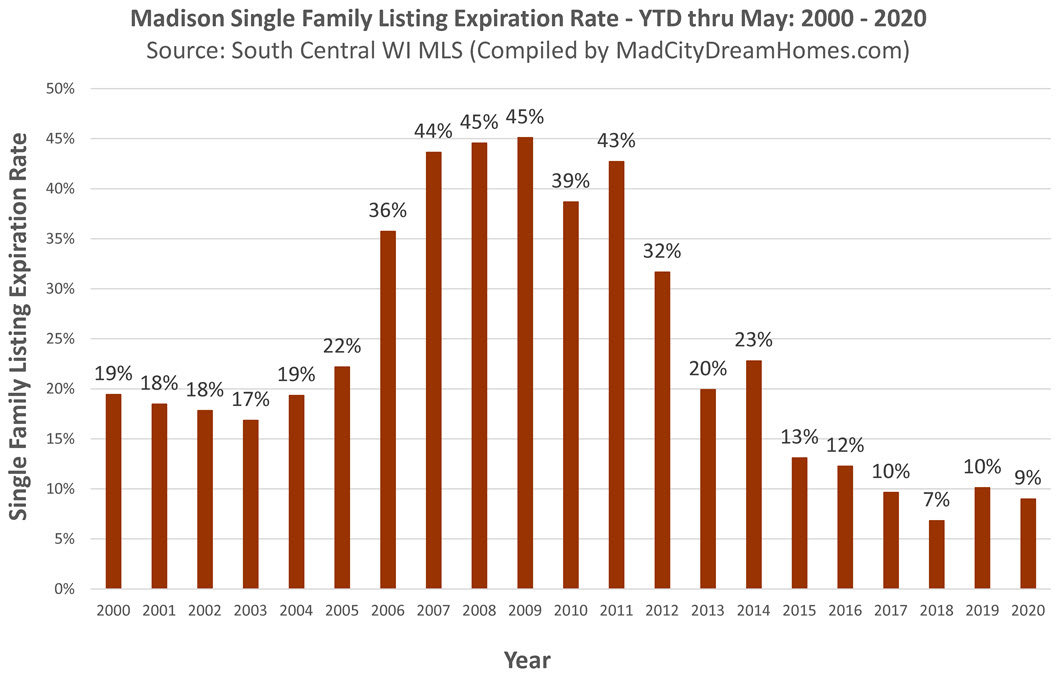
The year-to-date listing expiration rate through the month of March was 9%. This was the second lowest rate on record dating back to the year 2000.
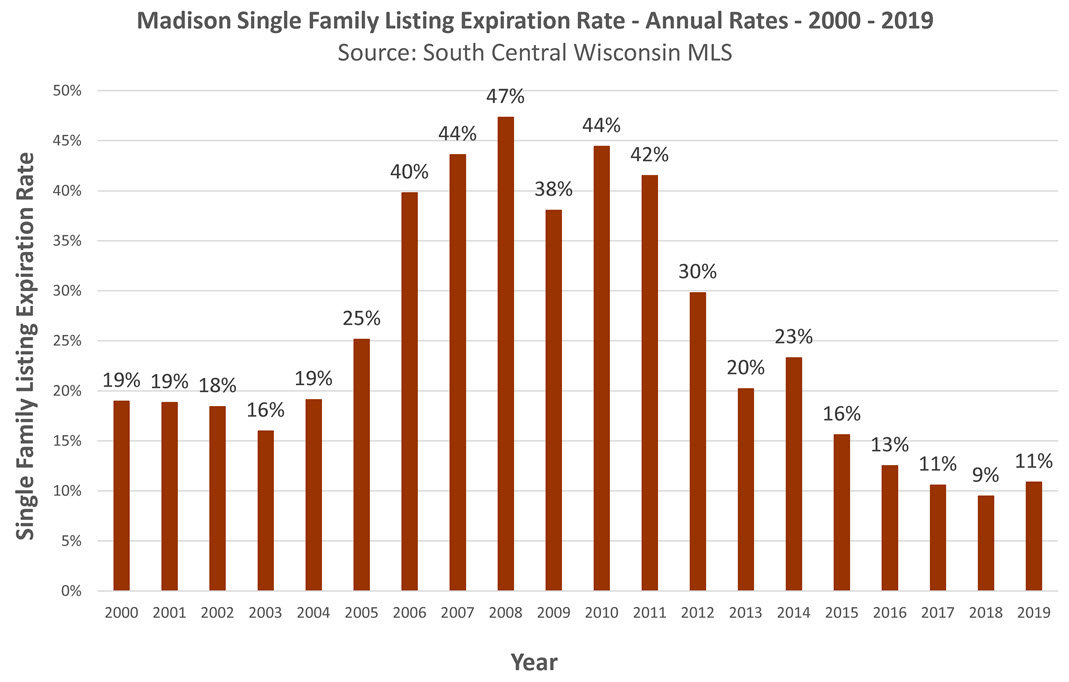
The annual listing expiration rate in 2019 was 11%, which was the second lowest rate on record for the Madison single family home market.
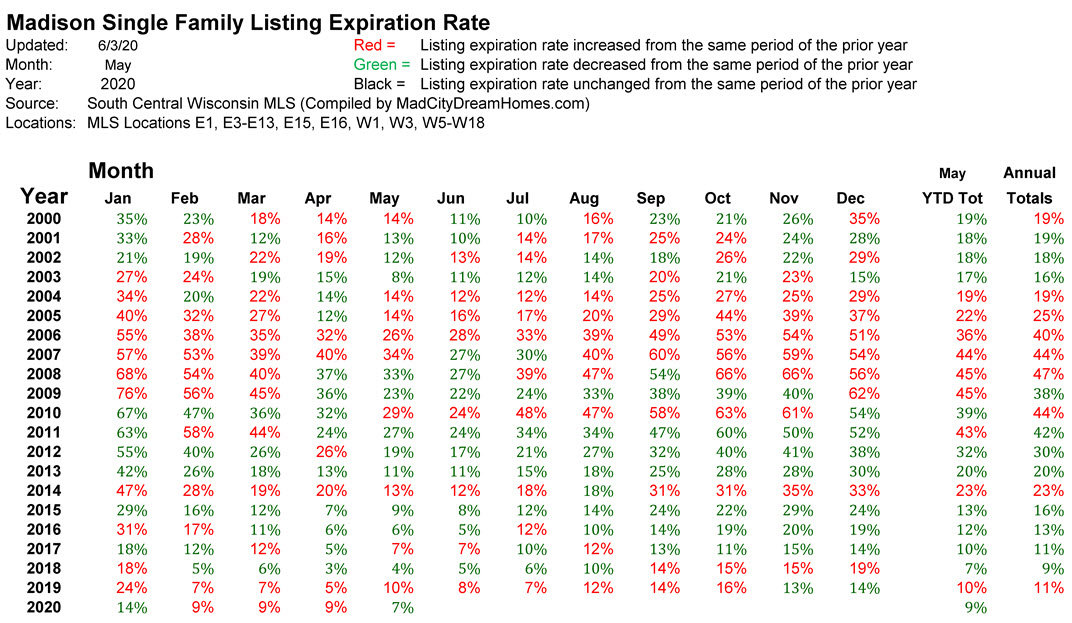
Madison Single Family Expiration Rate: Jan, 2000 - May, 2020
This table shows the monthly, year-to-date and annual single family listing expiration rate for every time period dating back to January, 2000.
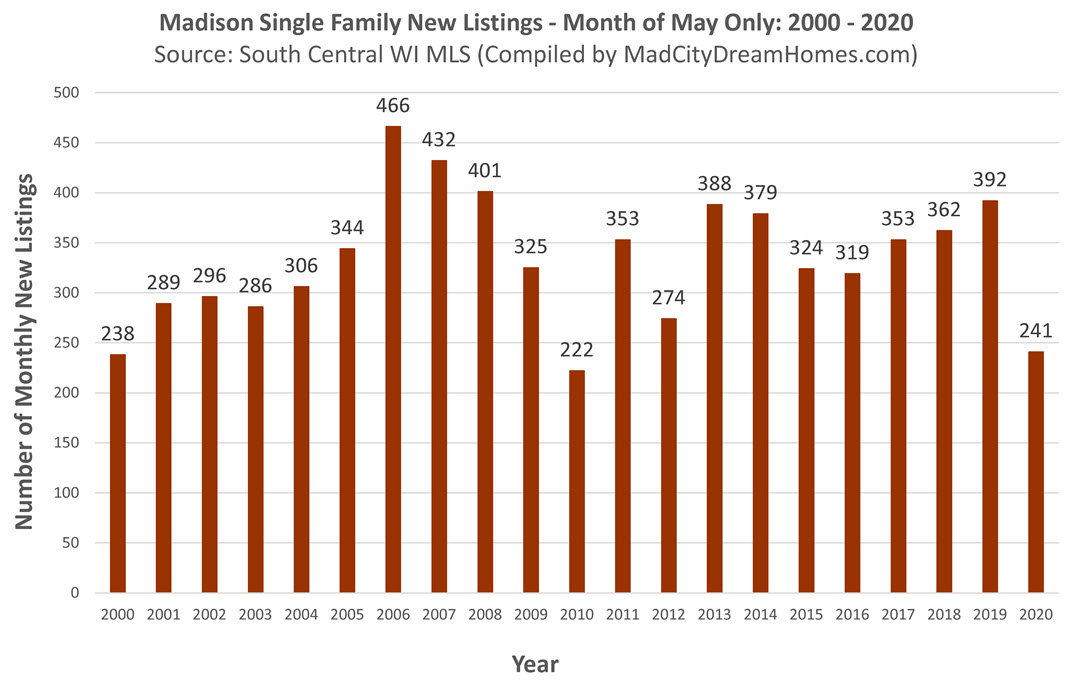
Madison Single Family New Listings - May, 2020
A total of 241 single family listings entered the Madison real estate market in the month of May - which was down 39% from May of 2019.
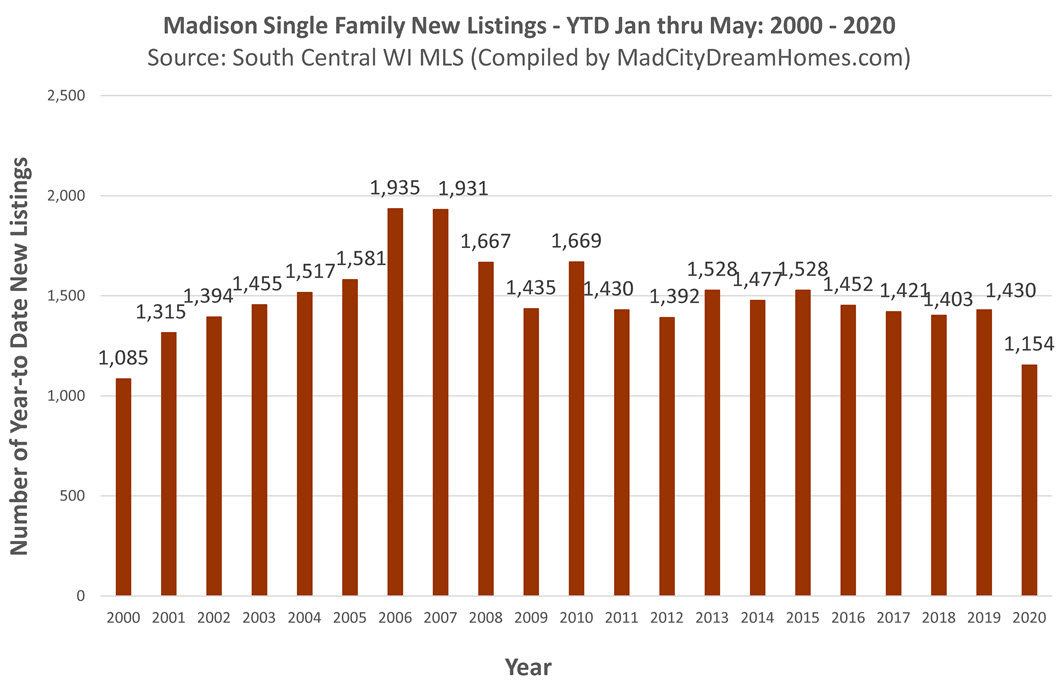
Year-to-date, a total of 1,154 new single family home listings entered the Madison real estate market through the month of May. This was the lowest year-to-date total since the year 2000.
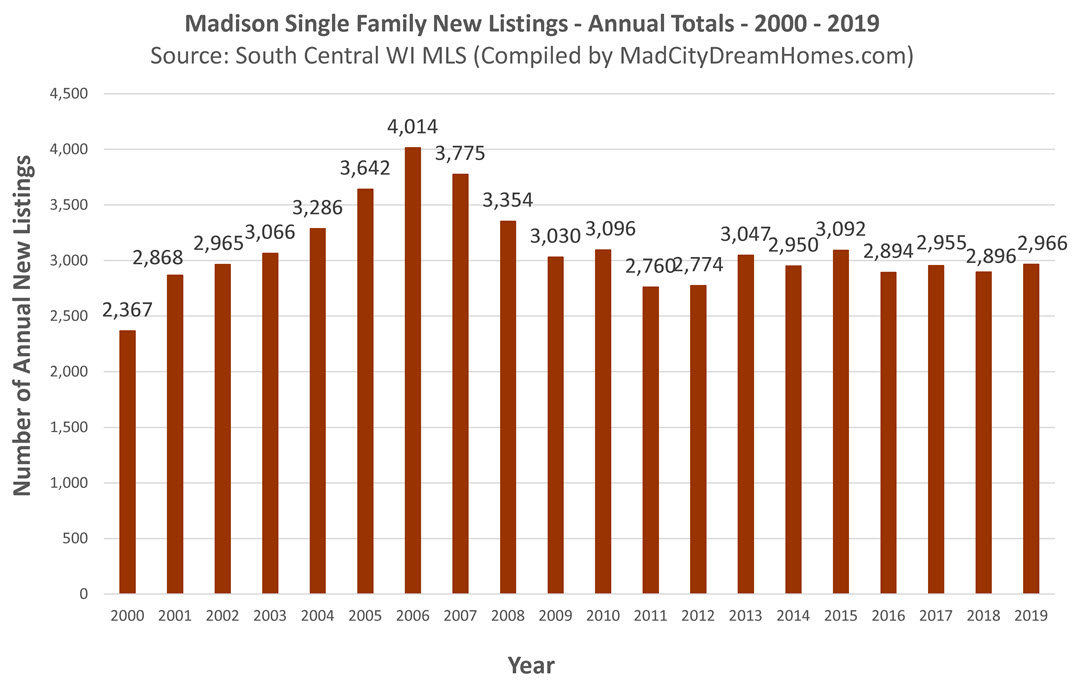
A total of 2,966 new listings entered the Madison real estate market in 2019. This annual total is relatively flat compared to the totals from each of the last 6 years. New listings have been entering the market at subdued levels for the last 11 years.
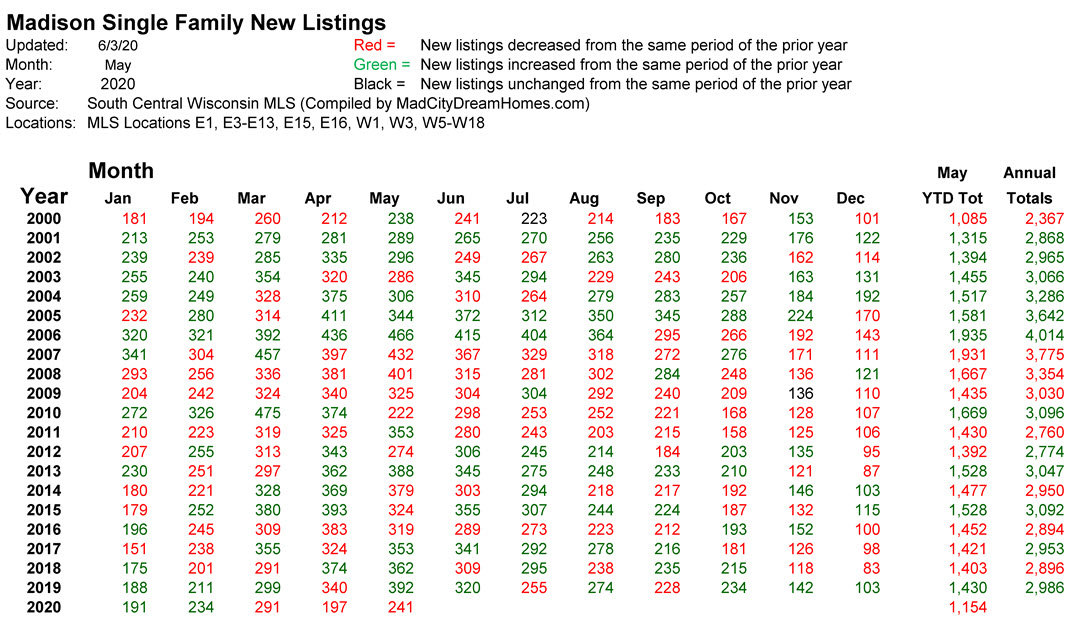
Madison Single Family New Listings: Jan, 2000 - May, 2020
This table shows the number of new listings by month dating back to January, 2000.
 .
.
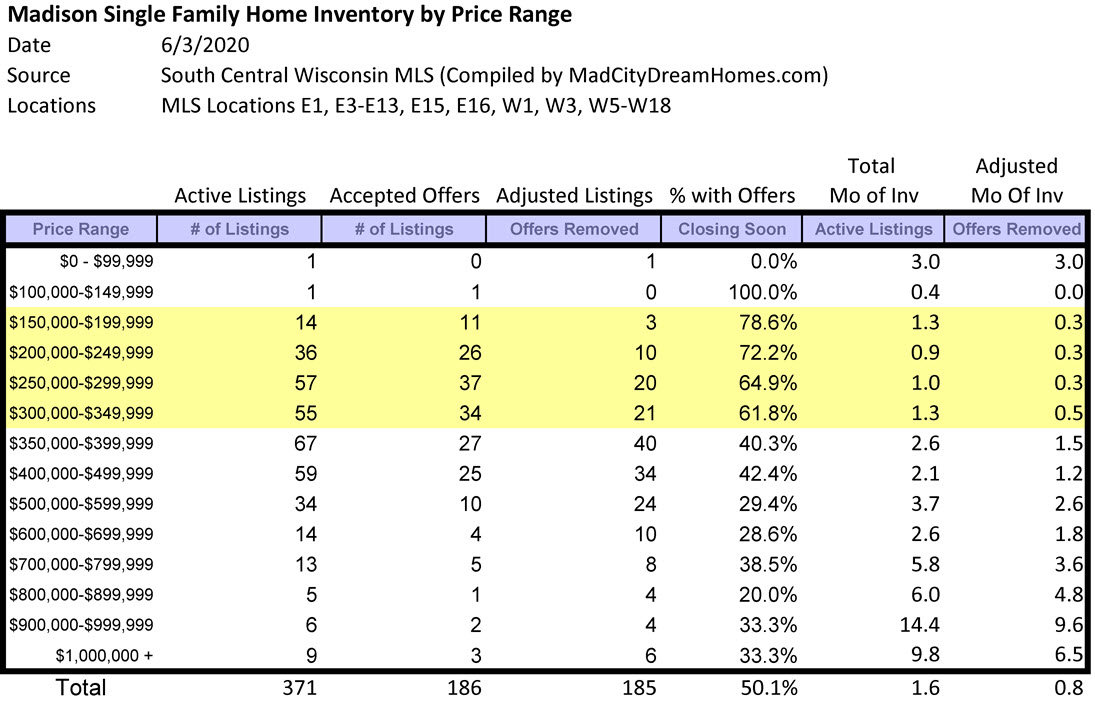
Madison Single Family Home Months of Supply - 6/3/2020
The table below paints a good picture of the single family home real estate market in Madison. The price ranges highlighted in yellow are most advantageous to sellers. Taking accepted offers into account, all of the price ranges under $350,000 have between .3 and .5 months of inventory (see the column on the far right). Also, a very high percentage of the listings priced under $350,000 are under contract with an accepted offer. Overall, 50.1% of all Madison single family home listings are under contract. There is less than a month of supply available in the Madison single family market as of June 3rd, 2020.
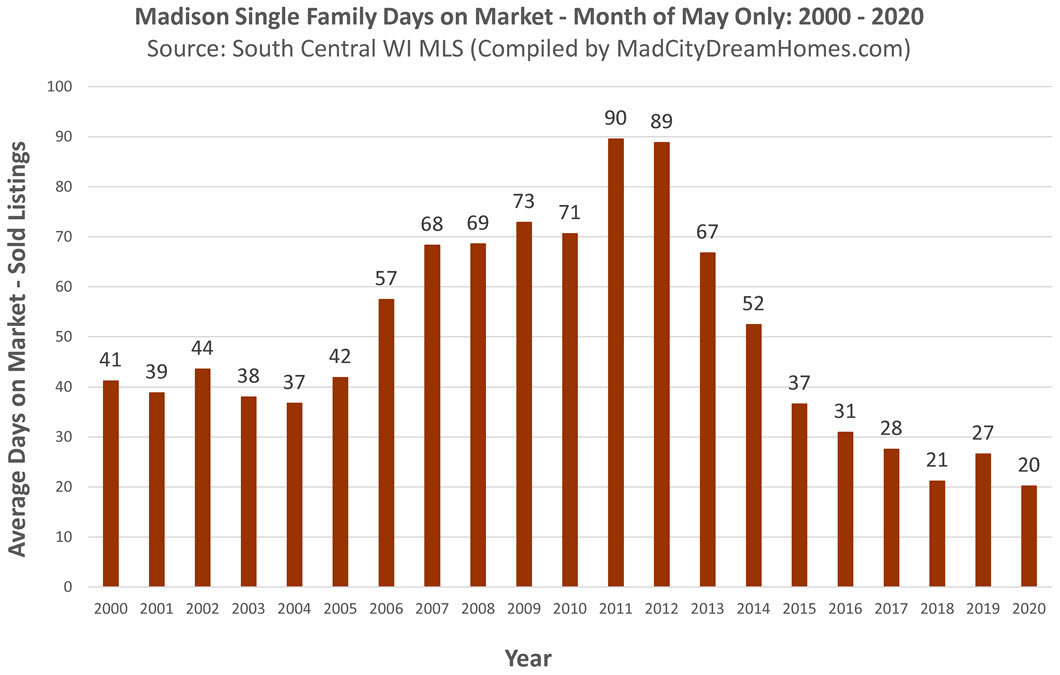
Madison WI Homes - Days on Market - May, 2020
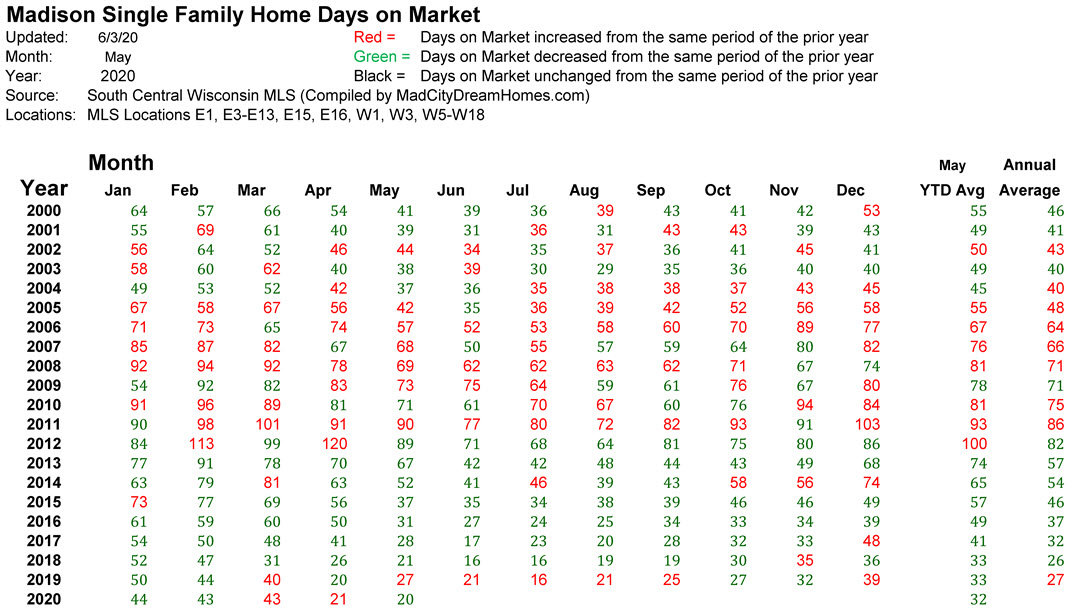
The days on market for a sold listing is the number of days from the date of listing until the date of the accepted offer. The average days on market for the month of May was only 20 days, which was the lowest on record.
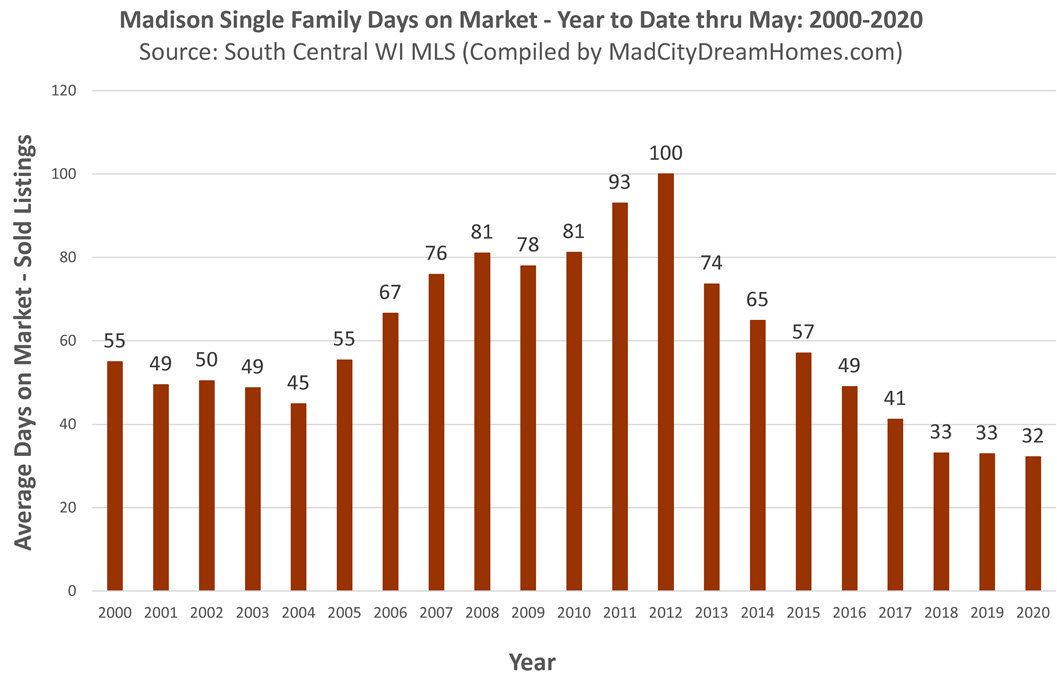
Year-to-date, the average Madison days on market through the month of May was only 32 days. As the graph below shows, this was the lowest year-to-date average on record.
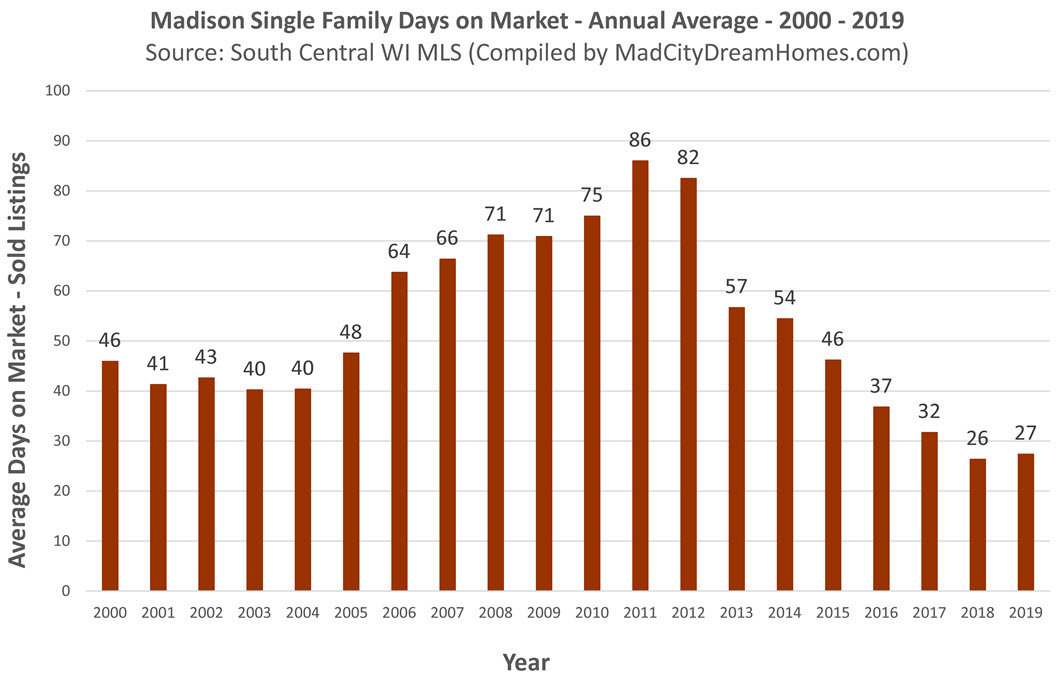
The average days on market for all of 2019 was only 27 days. This annual average was the second lowest on record.
Madison Single Family Days on Market: Jan, 2000 - May, 2020
This table shows the average days on market by month dating back to January, 2000. The Madison days on market statistic has been on a mostly downward path since 2012. The table also shows the seasonality of the market. Days on market tend to be lowest during the spring and summer months and highest during the winter months.
Madison WI Home Prices - May, 2020
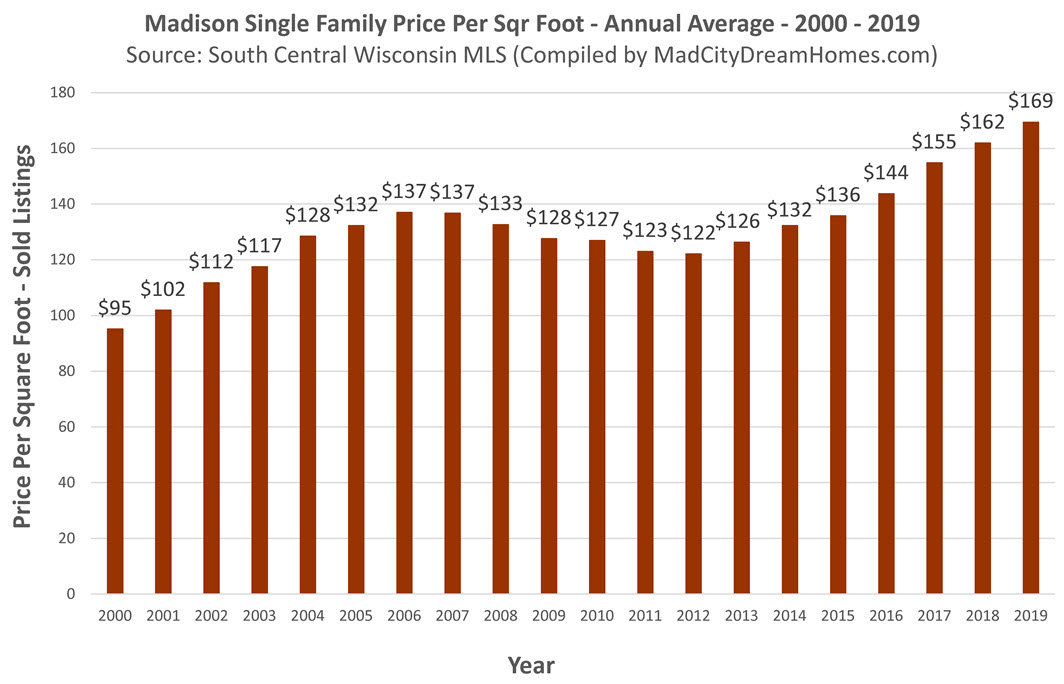
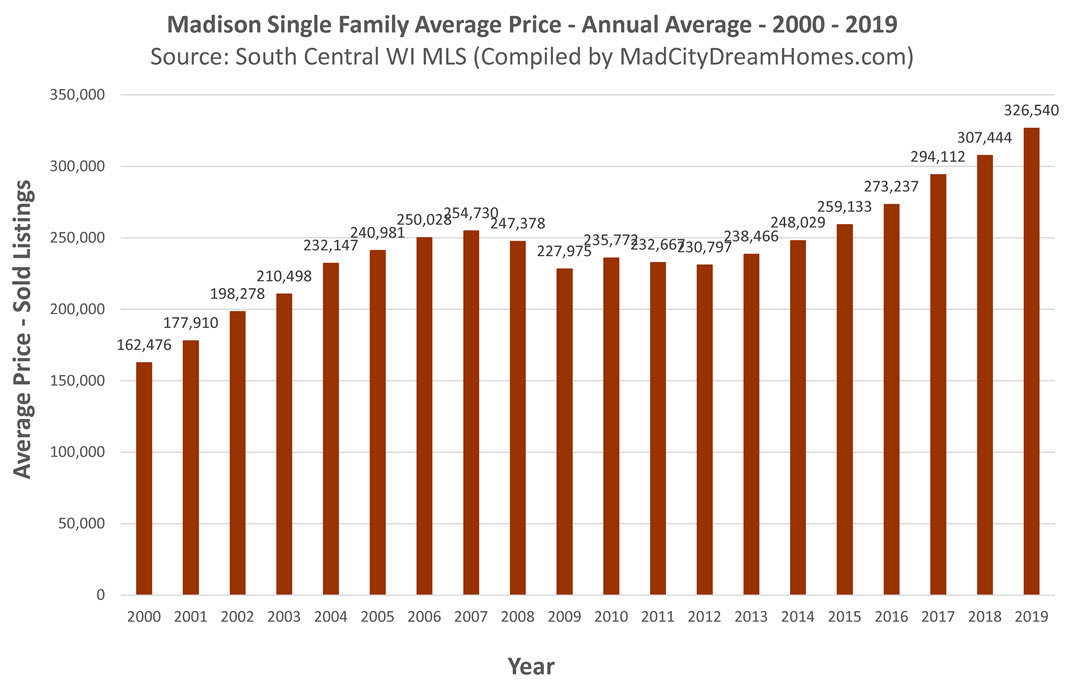
The price per square foot is the best statistic we have for measuring home values. The graph below shows the annual Madison single family home price per square foot for every year spanning the year 2000 to 2019. As the graph shows, Madison home prices have risen 7 straight years. Home values in 2019 were the highest on record for the city of Madison, rising by 5% from the year before.
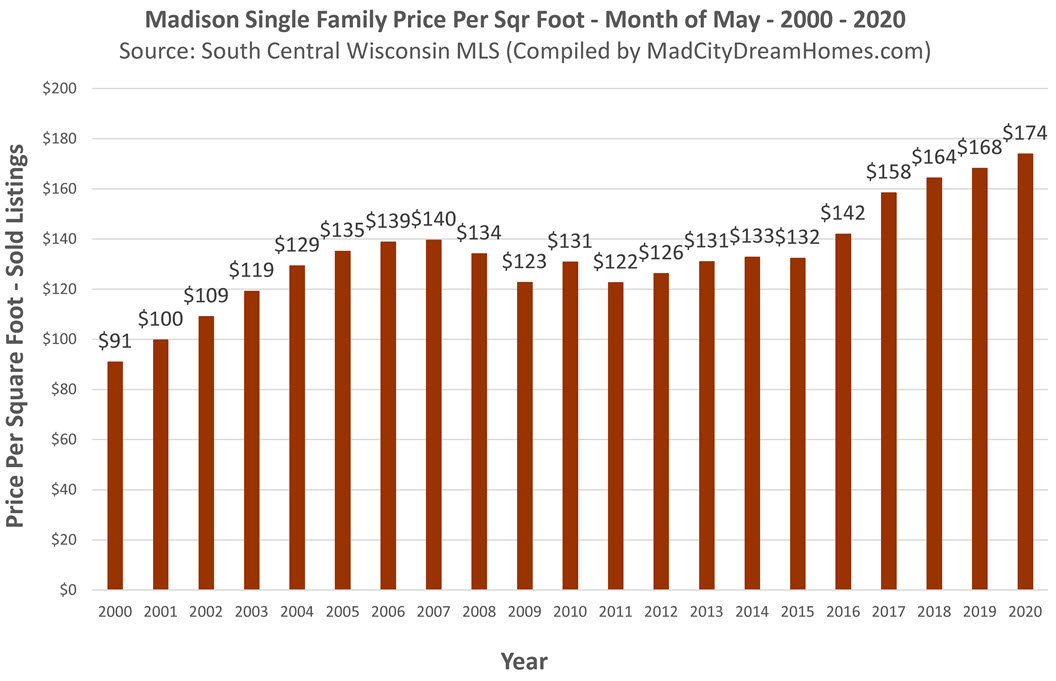
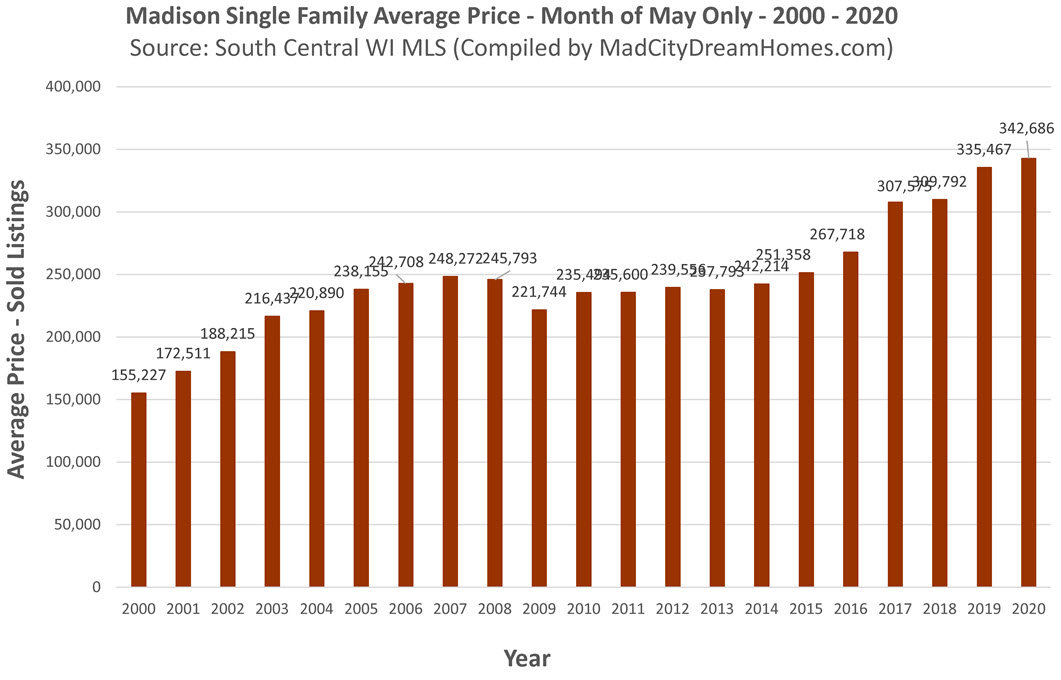
In May of 2020, the average price per square foot was $174 - up 3% from $168 last year. As the graph below shows this was the highest average for any month of May on record.
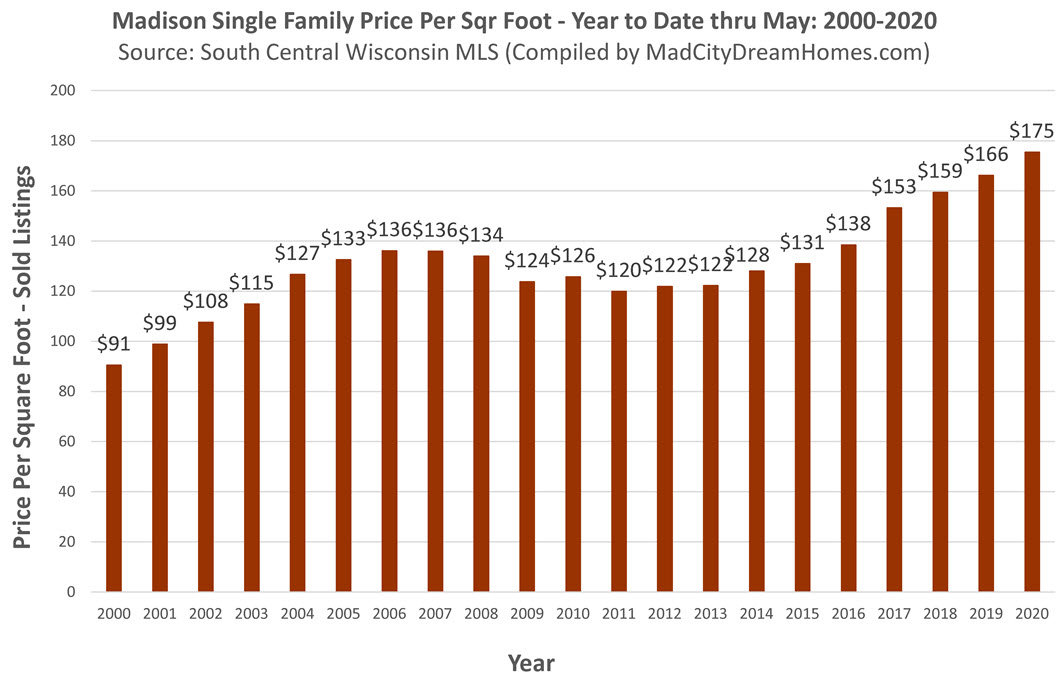
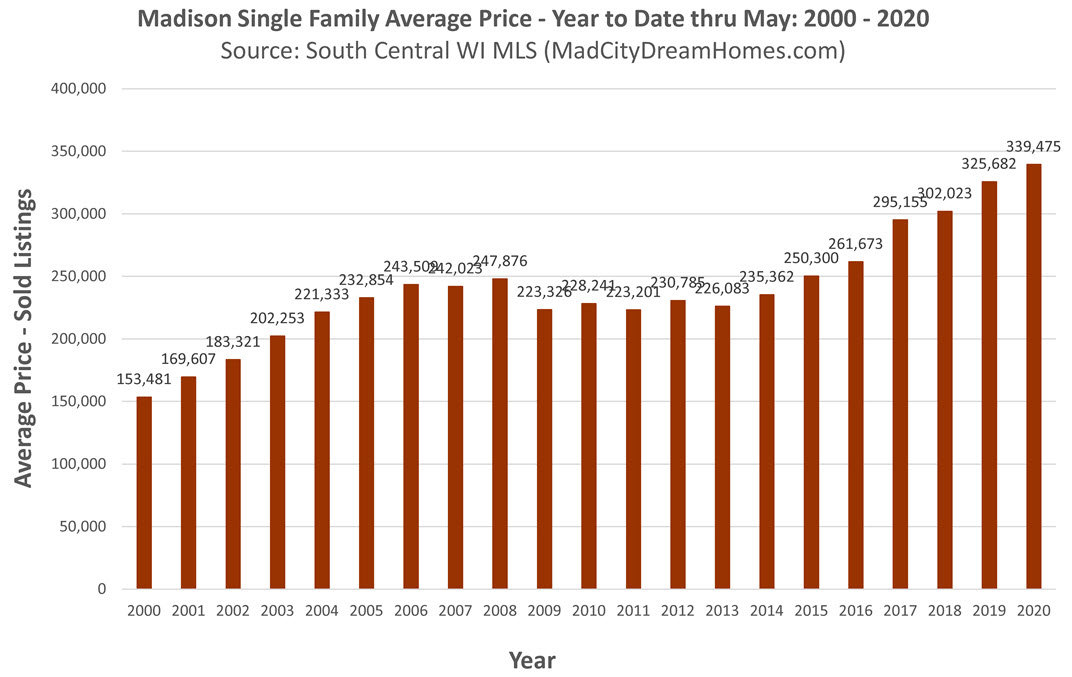
On a year-to-date basis in 2020, the average price per square foot through the month of May was $175, which was a new record high for the Madison single family home market - and up 6% from last year.
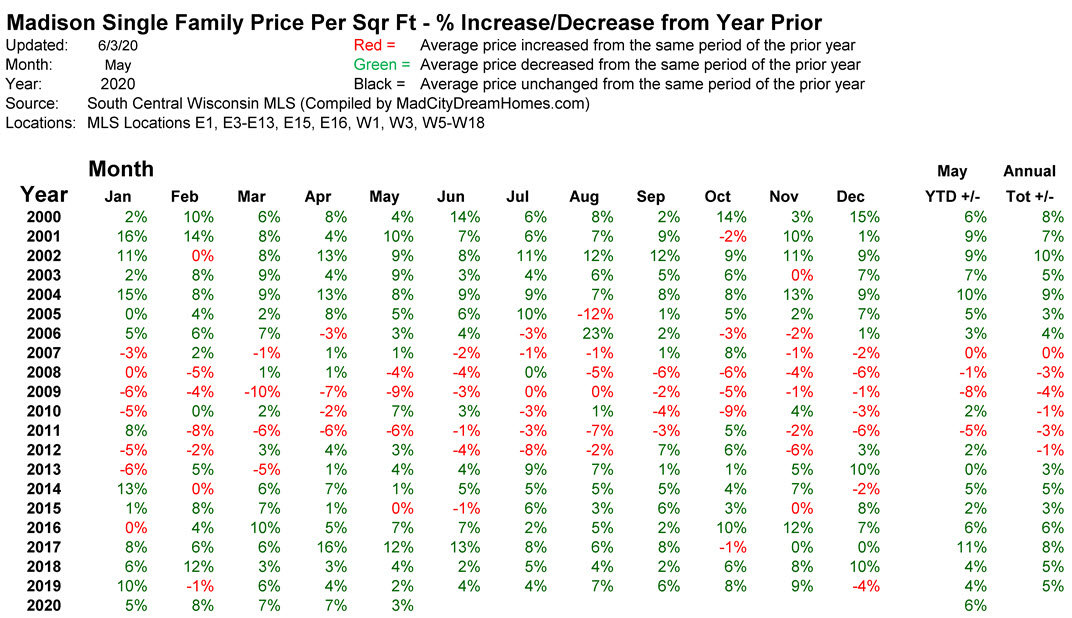
Historical Price per Square Foot - May, 2020
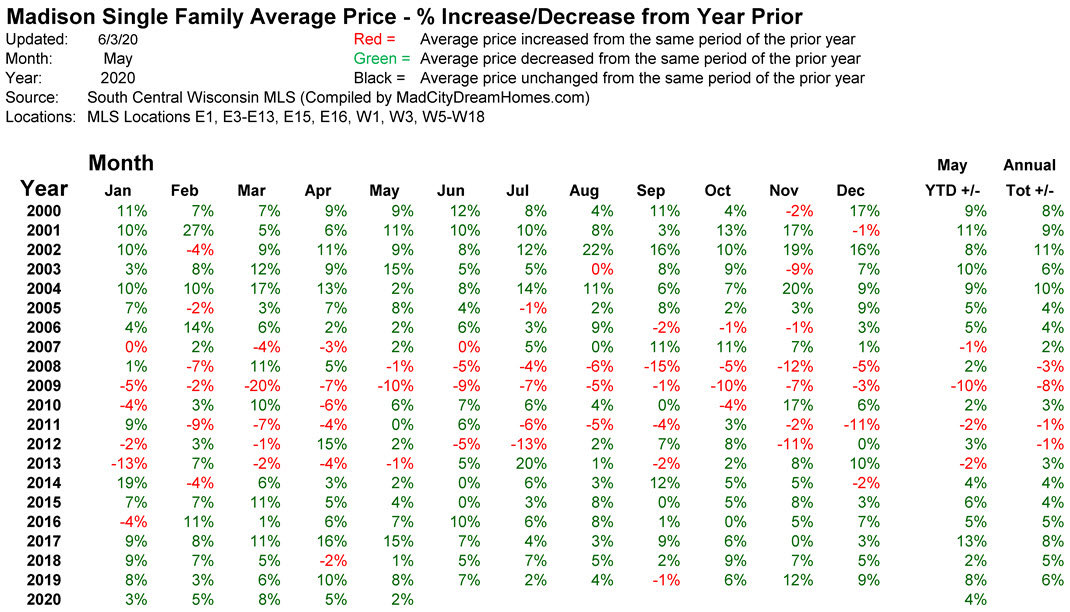
This table shows the price per square foot year-over-year increase/decrease for every month dating back to January, 2000. Year-to-date home prices are up by 6%.
Madison Average Home Price - May, 2020
The average single family home sales price in the month of May was $342,686, which was the highest on record and up 2% from last year.
Year-to-date, the average Madison sales price was $339,475. This is a record high for the Madison single family home market and up 4% from last year.
The average single family sales price for all of 2019 was $326,540. This annual average was the highest on record. The previous peak year for Madison home prices was 2007, when the average was $254,730.
Madison Home Prices: January, 2000 - May, 2020
This table shows the percent increase/decrease for every month dating back to January, 2000. As the green data points show, Madison home prices have been trending higher since 2013. Prices increased in 11 of 12 months in 2019 and started the year off higher in 2020.
Madison Homes - % with Competing Offers (December, 2019)
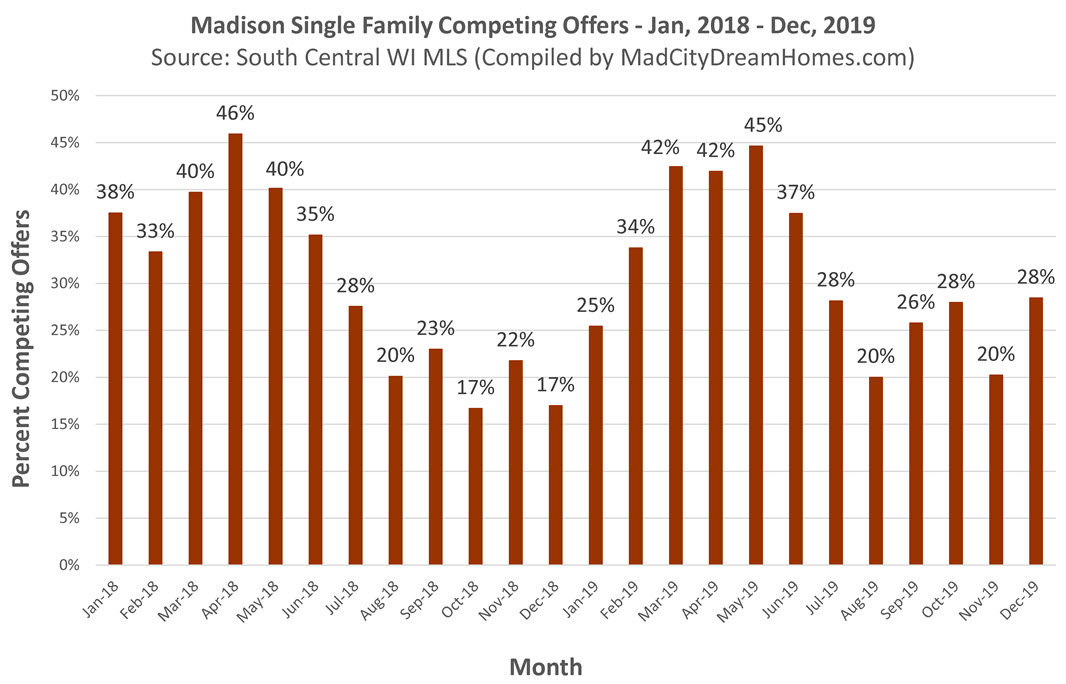
For listings that receive accepted offers, this statistic measures the percent that receive written offers from 2 or more competing parties. As the graph below displays, the months of March, April and May have the highest percentage of competing offers. Bidding wars and escalating prices are most prevalent during the Spring.
In the month of December, the percent of listings with competing offers increased from 17% in December of 2018 to 28% to December of 2019.
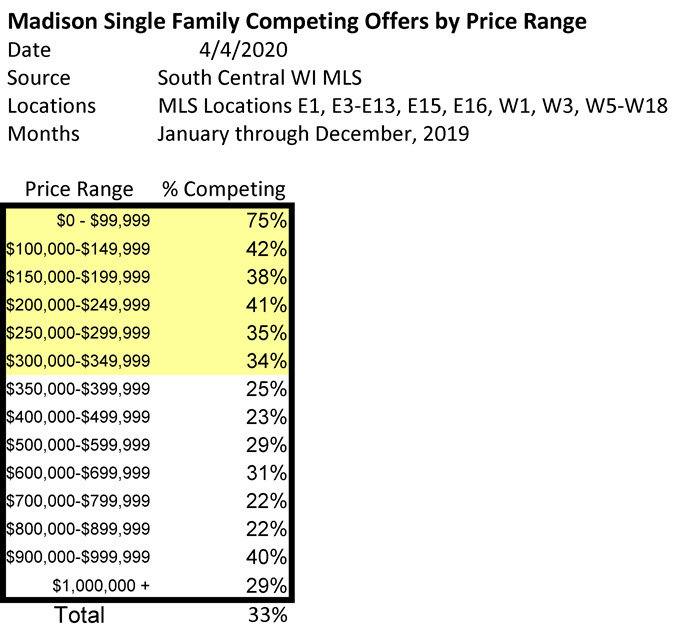
Single Family Competing Offers by Price Range: Jan-Dec, 2019
This table shows the percent of accepted offers that involve 2 or more competing buyers (see the far right column). The data shows single family home listings priced under $350,000 tend to be the most competitive. Overall, 33% of all accepted offers involved competition from multiple buyers in 2019. This is up from 32% in 2018.
About the Author
Dan Miller has been helping clients buy and sell homes and condos since 2007. Please feel free to contact Dan with any questions you have about the Madison real estate market or any other market in the South Central Wisconsin area.